How do you think I’m going to get along without you when you’re gone?
Coal retirements are going to continue to dominate conversations among ardent followers of the National Energy Market (NEM) in the coming years with lingering questions about ideal replacements unlikely to be answered anytime soon. Besides clean technology replacements on the supply side, the market is also experiencing significant changes to operational demand – driven by rapid uptake of rooftop solar – signalling a two-sided market transition is well and truly underway.
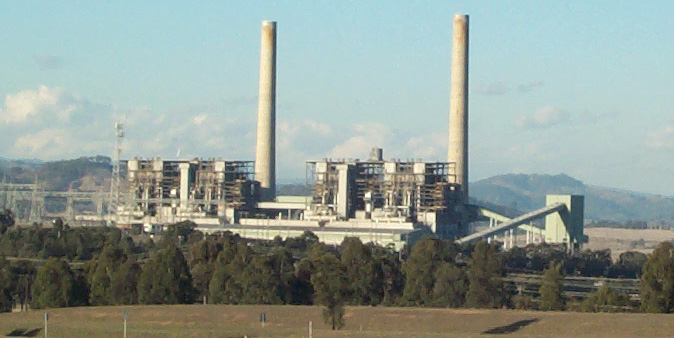
To understand the likely impacts of future coal retirements, we examine the impact of the most recent coal exit in the NEM (Hazelwood in Victoria). As seen in Figure 1, in FY16, Hazelwood supplied an average of 23% of daily demand in Victoria prior to exiting the market in March 2017. The presence of this high-polluting 1.6GW brown coal power station also ensured the state had enough reserves – including in peak summer months – to keep prices relatively stable (and to an extent, low) through the seasons. However, on 3 November 2016, its owner, Engie, announced the entire Hazelwood power station would be closed at the end of March 2017; giving the market just 5 months’ notice to replace ~23% of its generation source.
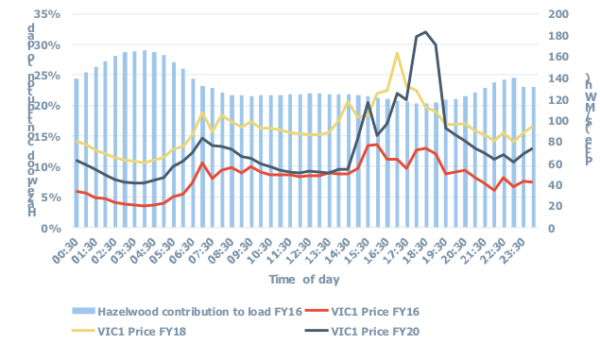
Image: Cornwall Insight
Unsurprisingly, as shown in Figure 1, prices in Victoria in the year post-Hazelwood increased dramatically across the whole day as higher-order gas-fired generation stepped in to fill the gap left by Hazelwood’s retirement. Average prices across the day in FY18 increased by 112% compared to FY16 prices with prices in the middle of the day (11AM to 2PM) also increasing by 83%[1].
A lot has happened however since the closure of Hazelwood, and Victoria has added significant renewable capacity (and rooftop solar) to replace the energy supplied by the brown coal power station. As shown in Table 1, between March 2017 and June 2020, Victoria added a total of 1.7GW in grid-scale capacity; with connecting regions – South Australia (SA), New South Wales (NSW) and Tasmania – also adding a total of 3.2GW in new grid-scale capacity.
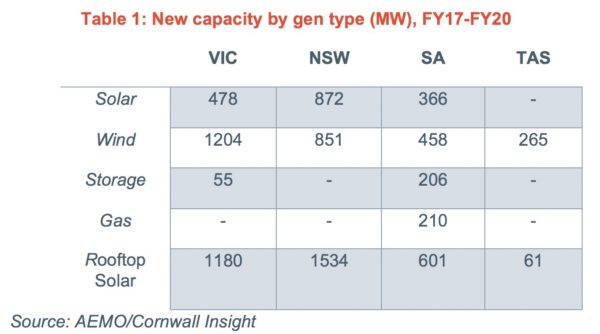
Fast forward to FY20, most of these price increases and impacts from the exit of Hazelwood has disappeared; as seen in Figure 1, average FY20 prices through the day in Victoria has dropped by 22% on FY18 levels. More tellingly, average prices in the middle of the day (11AM to 2PM) have actually reverted back to pre-Hazelwood exit days with a 42% drop on FY18 levels. A key driver – perhaps under-appreciated and inconspicuous – for this outcome is the role of rooftop solar and how much of the volumes from Hazelwood during the day has been replaced by this technology. As seen in Table 1, rooftop solar capacity in Victoria has not only grown by almost three times the growth of grid-scale solar, but it is also almost equal to the growth seen in wind capacity in the state since the exit of Hazelwood. In energy terms, and as shown in Figure 2, this phenomenal growth in rooftop capacity has reduced middle of the day demand (11AM to 2PM) from FY17 levels by about 445MW. This is equivalent to 38% of the average energy sent out by Hazelwood during the same time-of-day periods in FY16; an astonishing outcome. The impact of Hazelwood’s exit is now felt exclusively later in the day – during the evening peaks – especially in summer months, and as shown in Figure 1, this tightness is still driving the volatility seen in average price outcomes.
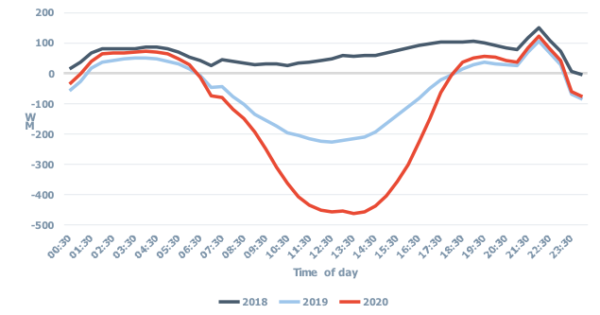
Image: Cornwall Insight
Windfarms in Victoria – the dominant form of renewable energy in the state – have also played a vital role in replacing energy supplied from Hazelwood (especially during the evening peaks) with an average of 645MW delivered across the day in FY20 (Figure 3). Wind output in Victoria, unlike the northern states, also boasts a phenomenal shape with only a 9% difference between its average peak and trough generation across the day in FY20.
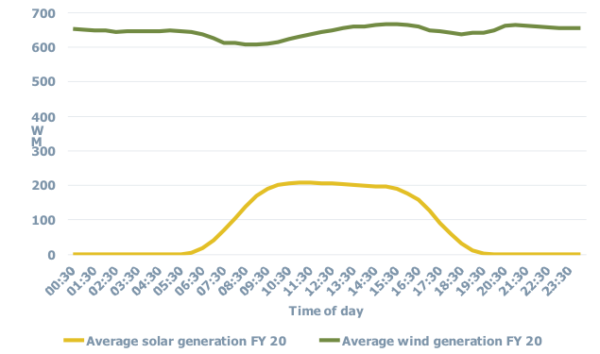
Image: Cornwall Insight
Another one bites the dust
So, if the market could largely replace the energy from Hazelwood in three years despite the short notice of its impending exit, what are we to expect going forward starting with Liddell’s impending exit in NSW in April 2023?
A key change that has happened since the exit of Hazelwood is around the notice requirements and advice from generators looking to exit the market. In a bid to avoid insufficient (and in the case of Hazelwood, exceptionally short) notice periods for major power stations exiting the market, the rule-maker – the Australian Energy Market Commission (AEMC) – in November 2018 made a final determination that requires large electricity generators to provide at least three years’ notice to the market before closing. Whilst this rule change gives the market certainty in exit timings, it however does not prevent generators from mothballing their units over extended periods prior to exiting the market.
AGL – owners of Liddell – however reaffirmed its intentions to close the black coal-fired station back in September 2017; giving the market about five years to plan its replacement. Given the lead time for this exit is significantly longer than the notice period for Hazelwood, and its contribution to demand in NSW (currently ~16%) slightly less than Hazelwood’s in Victoria (~23%) in FY16, are the impacts from this retirement likely to be similar to that of Hazelwood? How much of this capacity has been replaced so far, and is there going to be a reliability gap in NSW post-Liddell?
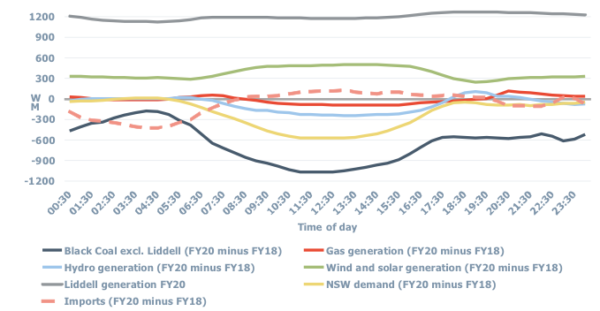
Image: Cornwall Insight
But I’m ready, yes, I’m ready for you
In Figure 4, we plot the time-of-day demand/supply changes in NSW since the announcement of Liddell’s exit back in FY18. As shown in the figure, the NSW market has undergone significant change since 2017 both on the demand and supply side. In fact, similar to Victoria, changes on the demand side of the market – driven by the rapid growth of rooftop solar – has had the most profound impact in displacing coal output through the day. In just two years, demand between 10AM-3PM has dropped by an average of ~547MW; 33% of Liddell’s operating capacity. In that time, on average, grid-scale renewable (solar and wind) generation during the day has also grown by ~490MW; about 30% of Liddell’s operating capacity. In FY20, coal generation (excluding Liddell) between 10AM-3PM has dropped by an average of 1GW since the time Liddell announced its exit; almost exactly equal to the increase in rooftop solar and grid-scale renewables. It is also important to note that there is currently about 1.7GW of new wind and solar projects committed in the region with the NSW government also considering options to support the development of Renewable Energy Zones (REZs) in the state. Nonetheless, given Liddell delivers a firm ~1.2GW through the day including during the morning and evening peaks, how has NSW fared outside solar hours since Liddell gave notice of its exit?
Since FY18, demand in the state during morning and evening peaks has largely remained unchanged (Figure 4); indicating the rather slow growth of distributed storage compared to rooftop solar. More importantly, this also suggests that NSW would need to have sufficient new generation (besides solar) and dispatchable reserves to meet its morning and evening peak demand post-Liddell. Whilst renewable generation (predominantly wind) in the state has grown by an average of 345MW and 280MW during the morning and evening peaks respectively, this generation remains weather-dependent and still a fair way off from the current output from Liddell during these periods (see Figure 4). This leaves dispatchable reserves (including demand response) as the only other ‘local’ option through which the state can replace Liddell’s output in peak periods. To understand what to expect from dispatchable reserves in the state post-Liddell, we plot the reserve duration curve for dispatchable capacity in NSW in Figure 5.
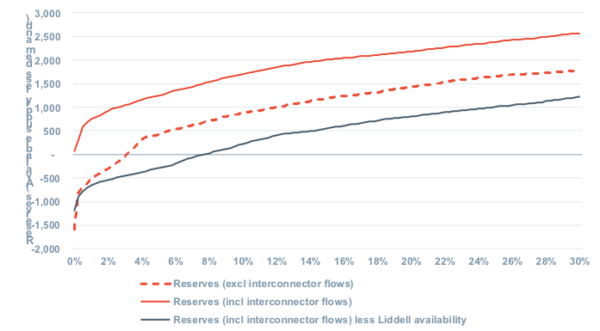
Image: Cornwall Insight
As shown in Figure 5, in FY20, for intervals when demand was greater than 10GW (~5% of total intervals), instances of NSW having a lack of reserves to meet peak demand was very limited. Reserves in this context refers to ability of current available supply (less demand) to meet incremental local NSW demand. On this reserve metric, NSW had reserves under 1GW just 2% of the time. It is important to note that this does not account for new investment to be made in the near-term or consider strategic reserves like demand response such as Tomago Smelter (where shutting down one of its three potlines can shave 300MW off demand). Removing the availability of Liddell from these figures, NSW would have had less than 1GW in reserve 24% of the time. Whilst this seems like a large number, NSW is currently reliant on other states to meet peak demand 11% of the time through interconnector flows.
However, as seen in Figure 4, exactly how much NSW can rely on other states for increased support during its peak periods post-Liddell is uncertain with the state increasing its daytime imports (mainly from Victoria) between FY18 and FY20 by twice its increase in evening peak imports. With Victoria and Queensland also facing retirements of their own, it is left to be seen how much support can come from SA through the proposed SA to NSW interconnector – Project EnergyConnect – in the future.
I’m standing on my own two feet
To understand how much support can come from SA post-Liddell through EnergyConnect, it is important to examine how imports/exports to/from the region has changed over the years.
As shown in Figure 6, before Hazelwood’s retirement, SA was a net importer from Victoria through the ‘typical’ day. However, since Hazelwood’s exit, SA has become a net exporter to Victoria with a bulk of these exports happening during the day. In FY16, SA imported an average of 221MW over the day from Victoria. Following Hazelwood’s exit, and in FY20, the region exported an average of 46MW across the day to Victoria. However, between 11AM-4PM, this average export figure increases four-fold to 164MW; an unsurprising outcome given the impact rooftop solar growth continues to play in the state by driving down demand during the day to record lows. When the sun sets however, the incentive to maintain this level of exports disappears with available generation meeting local demand instead. The role of gas in price setting in SA during these ‘non-solar’ periods also incentivises imports rather than exports. The key question then becomes, what role is SA exports – through EnergyConnect – expected to play in NSW going forward, and can the interconnector provide extra support to NSW during peak periods?
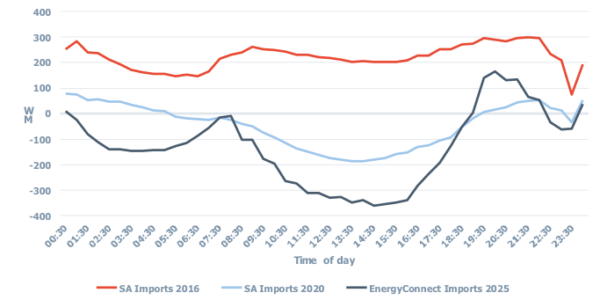
Image: Cornwall Insight
According to our in-house Cornwall Insight Australia Benchmark Power Curve (BPC) price forecast model, and as seen in Figure 6, flows on EnergyConnect – expected to be in operation from 2024 – are predicted to follow current export trends from the state with a bulk of the exports happening during the day. In its first year of operations, the BPC forecasts that the new interconnector would provide an average of 331MW of extra support to NSW between 11AM-4PM. However, as with the current export trajectories from the state, exports to NSW during the evening peaks are expected to drop to an average of 153MW with the state then importing energy from NSW during the late evenings (8PM-10PM). These expected trends for EnergyConnect from the BPC are entirely consistent with current export trends from the region. If interconnectors are unlikely to provide sufficient levels of evening peak support post-Liddell, what other options are available in the state given current market signals?
Machine guns ready to go
From a supply planning perspective and given the increasing amounts of energy during the day driven by the penetration of grid-scale and rooftop solar, the case for energy shifting technologies (such as battery storage) in NSW remains strong. However, to run, storage technologies – batteries – typically exploit arbitrage opportunity pockets in the market (price spreads); acting as load when prices are low (storing excess energy) and dispatching when prices are favourably higher. As shown in Figure 7, the merchant market in NSW is undergoing significant change. We are seeing a continuing trend of steeper evening peaks and lower day troughs. From FY19 to FY20, average prices between 7.30AM-3PM have dropped by 15-38% whilst prices between 4.30PM-6PM have increased by 10-40%. These daytime price troughs, whilst driven by increased (rooftop/grid) solar penetration, are beginning to create ideal market conditions (physical and financial) for battery storage technologies. It is left to be seen however, if these price and energy market trends alone are enough to incentivise new investment in storage technologies. So far in the NEM, battery storage projects have placed more emphasis on proceeds in the ancillary services markets over energy arbitrage.
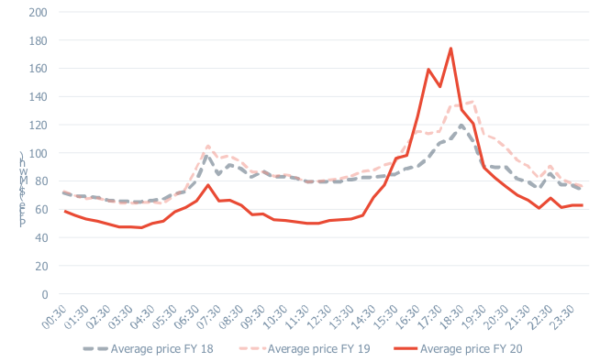
Image: Cornwall Insight
In conclusion, given the lead time the market has had to prepare for the exit of Liddell, and the extent to which the market has already displaced black coal output in NSW (especially during the day), the impacts from the retirement of this power station in 2023 should be milder than that of Hazelwood in Victoria in 2017. However, NSW may still have to increase its dispatchable reserves especially in the evenings. Given the excess energy the state (and to a large extent the NEM) is likely to have during the day, perhaps the state should look for ways to incentivise investment in more storage technologies with the ability to shift significant volumes from the daytime to the evenings. In addition, with support from other states likely to dwindle during peak periods, and the increasing presence of transmission constraints, locating a battery at the end of these constraints can allow for increased energy to be provided when it otherwise would not have been possible. As more regions prepare for coal retirements in the coming years, it is clear that the future NEM would need a range of new technologies from both demand and supply sections of the market to adequately replace the energy from these power stations. As we have seen from the retirement of Hazelwood and the impending exit of Liddell, the actual loss of a large coal station is less of an issue than the time needed to prepare and invest in their replacements.
[1] Broader demand/supply factors in the market (such as plant maintenance and outages) would have also contributed to this price outcome
Author: Lumi Adisa, Lead Consultant – Market Analysis, Cornwall Insight Australia –
l.adisa@cornwall-insight.com.au
The views and opinions expressed in this article are the author’s own, and do not necessarily reflect those held by pv magazine.
This content is protected by copyright and may not be reused. If you want to cooperate with us and would like to reuse some of our content, please contact: editors@pv-magazine.com.

2 comments
By submitting this form you agree to pv magazine using your data for the purposes of publishing your comment.
Your personal data will only be disclosed or otherwise transmitted to third parties for the purposes of spam filtering or if this is necessary for technical maintenance of the website. Any other transfer to third parties will not take place unless this is justified on the basis of applicable data protection regulations or if pv magazine is legally obliged to do so.
You may revoke this consent at any time with effect for the future, in which case your personal data will be deleted immediately. Otherwise, your data will be deleted if pv magazine has processed your request or the purpose of data storage is fulfilled.
Further information on data privacy can be found in our Data Protection Policy.