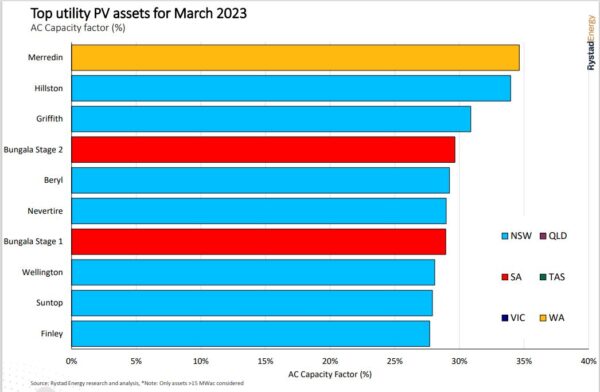
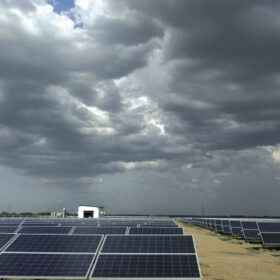
Large-scale solar farms in New South Wales (NSW) flooded the utility PV generation rankings last month with international consultancy firm Rystad Energy noting that seven of Australia’s top 10 best-performing assets in March are all located in the eastern state.
Rystad Energy Senior Renewables Analyst David Dixon said SUN Energy’s 100 MW Merredin Solar Farm in Western Australia’s (WA) central Wheatbelt region topped the rankings with an average capacity factor of 34.6% for the month but NSW facilities had dominated the charts, generating a combined 518 GWh over the month.
Canadian clean energy investment firm Amp Energy’s 120 MW Hillston Solar Farm in the Riverina region of southwest NSW was second in the generation performance rankings with a capacity factor of 34% across March while France-headquartered renewable energy developer Neoen’s 36 MW Giffith Solar Farm, also in the Riverina district, was third with a 30.9% capacity factor.
Sydney-based solar data specialist Solcast, which uses weather data and modelling tools to optimise solar PV systems, said the performances coincided with the demise of the La Niña weather pattern which typically brings increased cloud cover and rain to Australia.
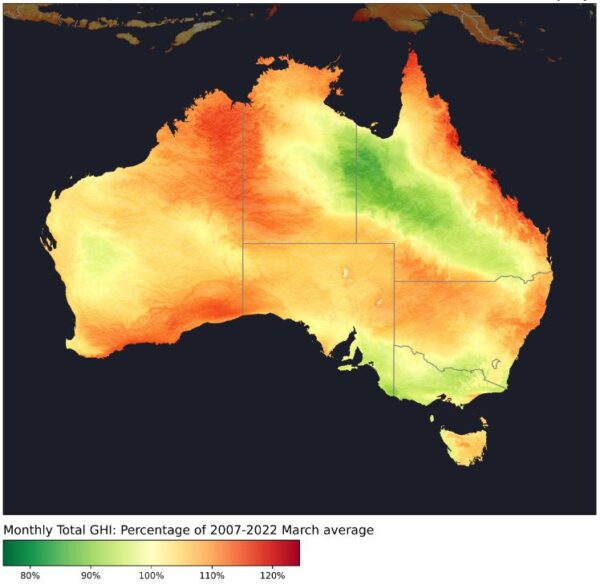
Image: Solcast
Solcast Lead Modeller Harry Jack said the end of the La Niña event meant most of Australia saw an increase in solar irradiance compared to long-term averages.
“Summer monsoon activity was reduced in general and focused primarily over the Gulf of Carpentaria and inland Queensland during March, so this region saw the biggest drop from its usual average irradiance,” he said.
“The remainder of northern Australia was left with less cloud and therefore higher irradiance than normal, following the end of the La Nina event. In particular, the east coast of Queensland saw irradiance up to 20% above average.”
This was reflected in Rystad’s analysis with Dixon saying utility PV saw substantial year-on-year growth in Queensland, with a 33% or 113 GWh increase on 2021 figures.
Jack said the southern parts of WA also saw higher solar irradiance due to less high cloud than usual.
Solcast said Victoria, southeast South Australia and southern NSW saw a 10% reduction in their usual solar levels during March as unseasonal bouts of south-westerly and southerly winds brought moist ocean air from the Southern Ocean, resulting in higher-than-normal cloud cover.
The weather conditions witnessed in NSW meant the state was Australia’s best renewable energy generator for the month, providing 1,010 GWh of clean energy, including 518 GWh from utility PV and 492 GWh from wind.
Sydney-based Solcast, which was earlier this year acquired by Norwegian energy consultancy DNV, said its data-driven approach to monitoring solar helps its customers plan and later dispatch energy on demand, helping them get the most out of their assets.
The company claims it can produce more than 600 million new forecasts every hour in a cloud-based environment, and provide real-time access to forecast data with a five to fifteen-minute resolution via an application programming interface.
Solcast, which also has offices in Asia, Europe and the Americas, said its data is used by more than 300 companies managing over 150 GW of solar assets globally.
This content is protected by copyright and may not be reused. If you want to cooperate with us and would like to reuse some of our content, please contact: editors@pv-magazine.com.


By submitting this form you agree to pv magazine using your data for the purposes of publishing your comment.
Your personal data will only be disclosed or otherwise transmitted to third parties for the purposes of spam filtering or if this is necessary for technical maintenance of the website. Any other transfer to third parties will not take place unless this is justified on the basis of applicable data protection regulations or if pv magazine is legally obliged to do so.
You may revoke this consent at any time with effect for the future, in which case your personal data will be deleted immediately. Otherwise, your data will be deleted if pv magazine has processed your request or the purpose of data storage is fulfilled.
Further information on data privacy can be found in our Data Protection Policy.