While this year’s megawatts of large-scale commitments are down on 2017 and 2018 levels, at over 2,500MW to November, they stand many times higher than any other prior year.
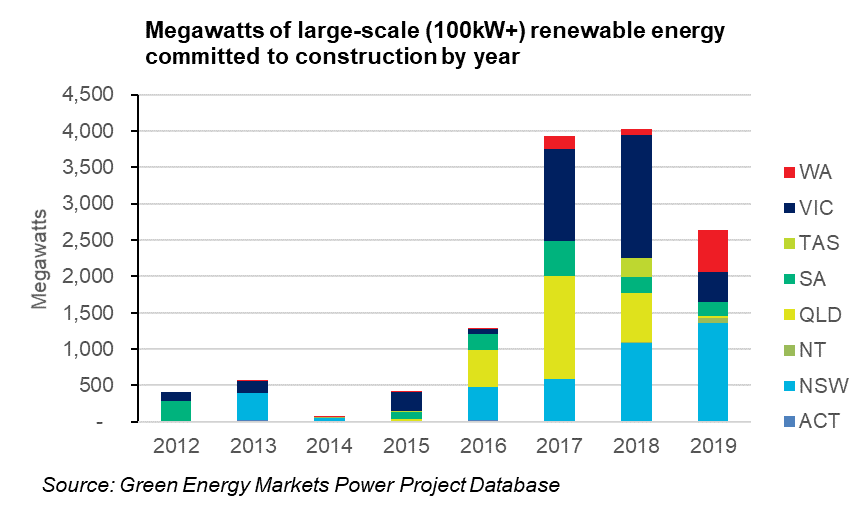
At the same time, sub-100kW rooftop solar installation levels this year are staggering and on track for comfortably more than 2,000MW.
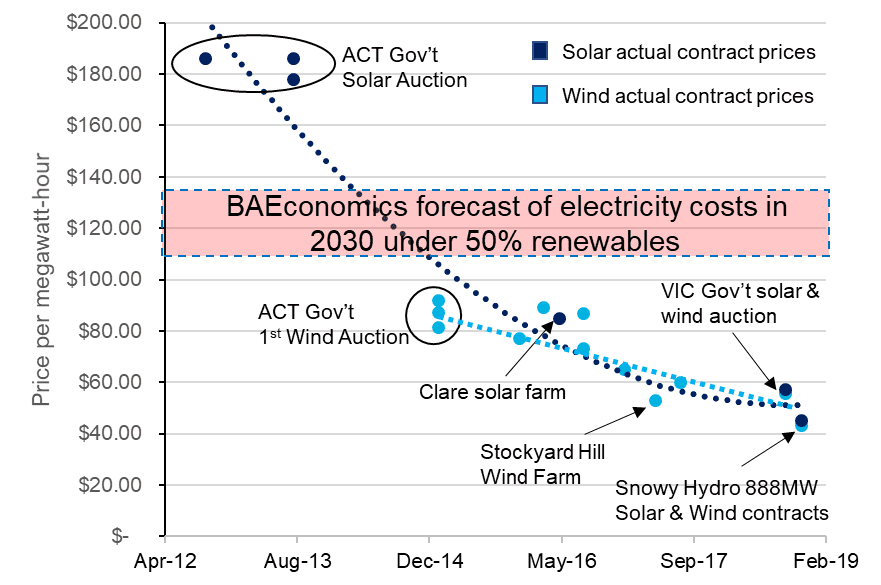
What has been particularly pleasing to see has been the steadily falling prices of renewable energy under announced long-term contracts. Over the past 18 months we have a seen a steady stream of large corporate entities announcing deals to contract new wind and solar projects to lower their energy costs, not just to burnish the environmental image.
Power contract prices announced for wind and solar projects in Australia since 2012
The scale and speed of what has been achieved can be intoxicating for many of those who have battled over many years to get government to recognise the potential of renewable energy to affordably meet our needs for energy while containing global warming.
Given there is room for plenty of further technological improvement, it can be tempting to believe that those tough times are now all behind us, and we can look forward to year after year of new heights.
Unfortunately you’d be wrong.
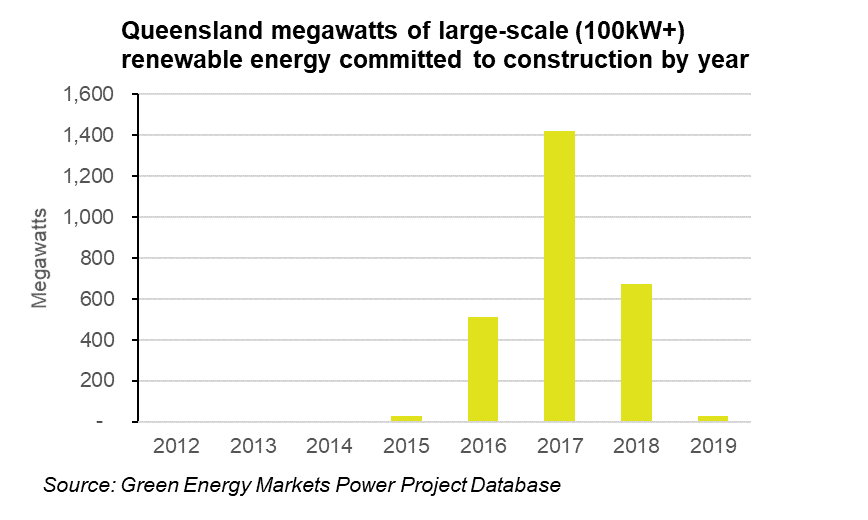
While the first chart above shows an aggregate picture that looks incredibly rosy, hidden within it is a canary in the coal mine – Queensland.
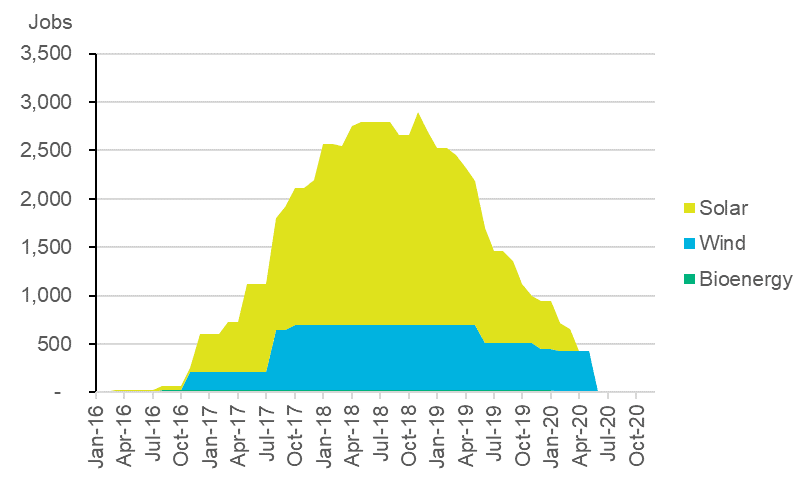
The figure below illustrates the implications for employment, providing an estimate of the amount of full-time equivalent jobs engaged in construction of utility-scale (5 megawatts or greater) renewable energy projects. The renewable energy project commitments since 2016 led to a surge in construction activity and employment which likely peaked in November 2018 at about 2,900 full time equivalent jobs.
Since then employment has fallen precipitously as solar farms in particular, have reached completion. As of November this year we estimate employment will have dropped below 1,000 full time equivalents. Once Coopers Gap Wind Farm is likely to be completed around April next year, employment will have fallen to zero unless we see a complete turnaround in investment commitments.
Queensland utility-scale (5MW+) renewable energy construction jobs by month January 2016 to December 2020
What’s behind this collapse in investment and is it likely to spread?
The first thing to keep in mind is that the boom in large-scale renewable energy investment in Queensland was part of a broader national trend. In 2016 prices for renewable energy certificates (known as LGCs) had surged above $80 per MWh reflecting the fact that we were a long way short of having enough projects to meet the Australia-wide 2020 Renewable Energy Target. We have now put in place so much new capacity that the Renewable Energy Target will be substantially oversupplied by 2022.
Consequently the price for renewable energy certificates have collapsed and those scheduled for delivery in 2022 are changing hands at $15, while 2023 certificates are worth $10. Nothing is traded beyond that year but you could confidently expect they’d be worth even less.
The reality is that if you’re considering construction of a new renewable energy project, by the time it is likely to be built you’ll receive little to no financial benefit from the fact that it reduces Australia’s emissions, unless policy changes.
The second part of the equation comes down to electricity prices. Since 2017 wholesale power prices have been very high, indeed substantially higher than the contract prices that renewable energy projects have required to proceed. This has helped fuel optimism that renewable energy investment could continue to boom even if we had no meaningful emission reduction policy.
What many may forget is that it wasn’t all that long ago that federal government politicians, electricity companies and even AEMO’s former CEO Matt Zema complained that we had too much electricity generating capacity.
In 2015 power prices in Victoria used to average just $34 per megawatt-hour (time-weighted) and in NSW they averaged $39. At that time Queensland actually had the highest power prices of the NEM states at $52, although this is still very low compared to 2017 and 2018.
The chart below details the average price solar generation in each state would receive for its power relative to the 24 hour average on the wholesale market for that state. It shows power price leapt incredibly after 2016. Across NSW, Victoria and South Australia prices since 2017 are well above the kind of prices we are hearing about for recent solar power purchase agreements. Even in the case of Queensland we see that the average price received up to September this year at $60 sits above recent PPA prices.
Solar generation average wholesale market price relative to overall market 24hour average

This would seem to suggest all is rosy. But if you delve into wholesale power price data over the last few months you see something suddenly change.
Below is the average Queensland wholesale price by hour of the day (24-hour clock) covering January until July across each year since 2015. 2019 is shown in red and it looks very similar to 2016 and 2018 and is well above the depressed prices of 2015 shown in dark blue. So seems like not much to worry about.
Queensland Wholesale Power Prices by hour of the day averaged across January to July

But since August, during the middle of the day when solar power output peaks Queensland appears to have gone back in time to market conditions akin to or worse than the oversupply conditions of 2015.
Queensland wholesale power prices by hour of the day across the months of August to November

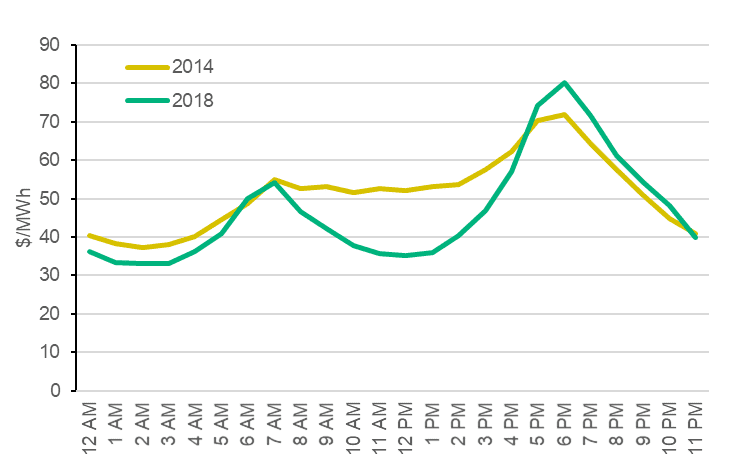
Victoria and NSW over these same months have not experienced this same solar-generation price depression effect but South Australia most definitely has. In addition, Western Australia’s Electricity Market is experiencing a similar effect in its short-term balancing market as shown by comparing 2018 prices by hour versus those of 2014. For 2019 up until mid-September Western Australia’s balancing market had recorded negative prices between 10am and 2pm for slightly more than 1 in every 7 days (44 days out of 254).
Average Western Australian STEM prices by hour – 2014 vs 2018
Queensland, South Australia and Western Australia are at the leading edge of this solar price depression effect because solar capacity represents a larger proportion of electricity demand in these states, compared to Victoria, NSW and Tasmania. But NSW has now overtaken Queensland in terms of solar farm and rooftop solar capacity additions. Victoria has also substantially stepped up its level of rooftop solar installations.
At present these two states don’t have the same level of excess coal generating capacity that Queensland has, but they are adding a lot more wind generating capacity. Ultimately they too will see depressed prices in the middle of the day. Victoria (and South Australia) will also see an increasingly significant wind generation price depression effect.
This is great news for electricity consumers.
Unfortunately though, it means NSW and Victoria will likely follow Queensland’s footsteps of a renewable energy investment collapse in a year or so’s time. The one caveat is that maybe our governments’ will take their climate change commitments seriously, or another coal generator calls it quits.
The views and opinions expressed in this article are the author’s own, and do not necessarily reflect those held by pv magazine.
This content is protected by copyright and may not be reused. If you want to cooperate with us and would like to reuse some of our content, please contact: editors@pv-magazine.com.


Does this represent a business opportunity for battery storage in Queensland? See the four charts in one image near the bottom of the story.