From a power demand perspective, with the weather mild enough not to require extra heating or cooling for open spaces, moderate power demand levels are typically observed in spring and many minimum (operational) demand records are also broken in this season. However, a key contributor to minimum ‘operational demand’ is the energy yield from rooftop solar. This Opinion and Analysis piece presents a deep dive into the unprecedented impact of rooftop solar in the NEM.
To the rescue, here I am
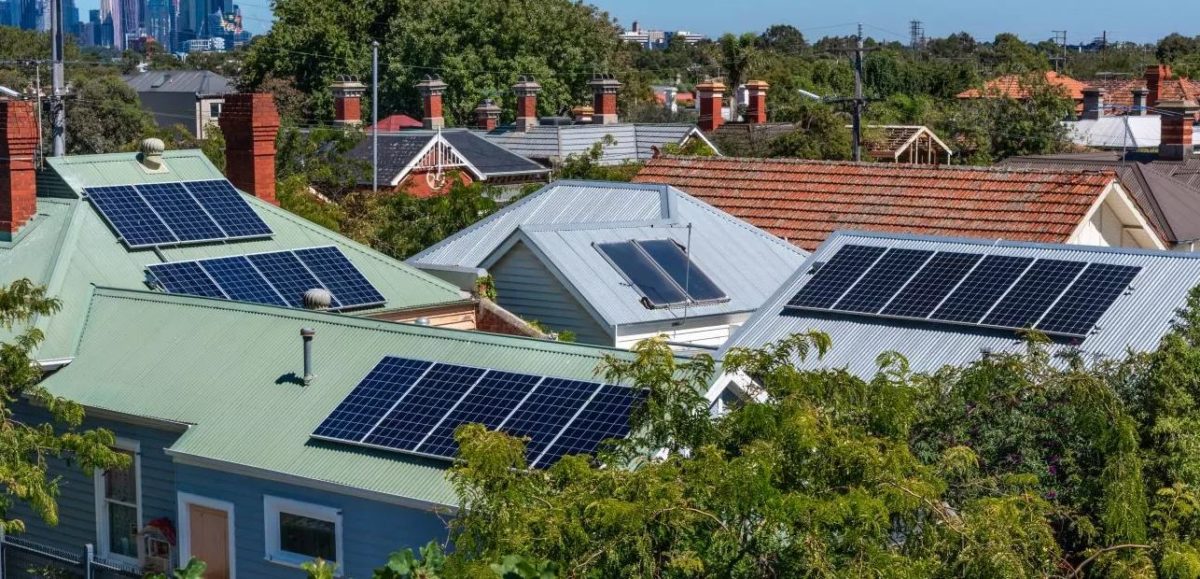
Per capita, Australia is currently the global leader in rooftop solar installations with about one in three homes generating their own power. In 2022, rooftop solar contributed a staggering 26% of total renewable electricity generation in Australia with the total installed capacity currently almost double that of grid-scale solar across the NEM (16.3GW vs 8.7GW). This astonishing growth in rooftop solar started well over a decade ago through very generous (and arguably uncoordinated) federal and state government policies and rebate schemes which assisted many households overcome the upfront installation cost hurdle. As technology breakthroughs led to downward pressures on the cost of solar panels, many Australian households saw this technology as a great hedge against rising power prices through the years.
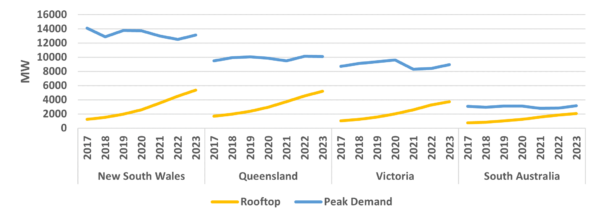
Image: Lumi Adisa
The rooftop solar phenomenon in Australia has had significant impacts across the NEM, including changing the intraday demand shape, revenue cannibalisation for large-scale solar projects, changing the intraday operations of thermal assets, as well as an increased need for flexible generation through a changing intraday ramp profile. As seen in Figure 1, across all mainland states, rooftop installations in the last six years have grown by factors of 3x to 4x across all mainland states – an astonishing outcome. New South Wales, in particular, has seen such huge growth in the last six years that it has just recently overtaken Queensland (the ‘Sunshine State’) as the leading state in Australia in rooftop installations. However, across the same mainland states, operational peak demand has remained relatively flat over the same period.
Want you to know, y’all, can you understand?
As defined earlier, operational demand is the total demand less rooftop/embedded generation. Therefore, assuming that total demand remains the same, as rooftop generation increases, operational demand during the day decreases. Given operational peak demand in Australia occurs after sunset, this implies that rooftop solar generation is a key driver of intraday ramping needs in the NEM across all mainland states.
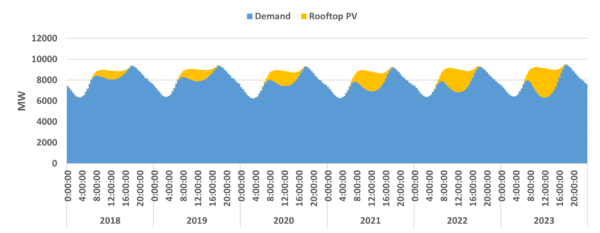
Image: Lumi Adisa
As seen in Figure 2, the intraday demand ramp (down and up) – driven by rooftop PV growth – in New South Wales in particular (also true for all mainland states) has been growing over the years. This is expected to continue driving investment in flexible resources. The average demand trough to peak ramp in New South Wales is now about 3 GW. With the state facing a significant supply gap from coal retirements (about 6 GW) in the next 10 years, it is yet to be seen how this ramp profile will be met by gas and storage technologies. Recently, there have been announcements of large battery projects in the state such as the Riverina and Darlington Point Energy Storage Systems. Another key development to watch in the storage space is the 2 GW Snowy 2 pumped hydro project; it is unclear how quickly the project developers can bring the project online to help manage this growing intraday ramp in the state.
On a positive note, this rise in rooftop installations in New South Wales has (to an extent) masked the supply gap left by Liddell’s retirement last year. Perhaps these two events (Liddell’s retirement and recent rooftop growth) are related and to be expected as consumers try to protect themselves from high power bills left by wholesale supply shortage – though this is one for further analysis.
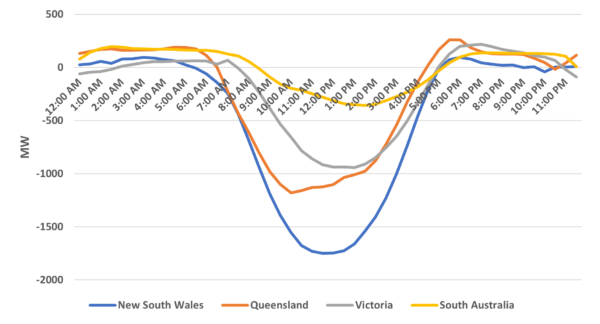
Image: Lumi Adisa
As mentioned above, this ramp trend is seen in all mainland states and represents an ongoing challenge state and federal government and other policy makers must solve as thermal coal assets progressively exit the NEM. Figure 3 depicts the difference in average time-of-day demand between 2023 and 2017 across all mainland states. While peak demand in these states has hardly moved, the trend for demand within the day has shifted (and continues to shift) predominantly driven by rooftop solar. The common trend seen across all states is the drop in midday demand and an increase in the non-daylight hours demand; highlighting the continued impact rooftop solar is having on ramp profiles through the years.
In Queensland, the average midday demand has dropped by over 1 GW whilst the evening peak has increased by over 250 MW in six years. Victoria has seen a similar stretch of the intraday demand profile over the same period with midday demand dropping by about 1 GW and the evening peak increasing by over 200 MW. New South Wales – which has the largest peak load – has seen the biggest change in its intraday ramp with average midday demand dropping by close to 2 GW and the evening peak increasing by about 100 MW. These trends call into question the evolving flexibility needs in each state and what the ideal generation mix should be for the future NEM given the (somewhat) inflexible profiles of the existing coal generation assets which dominate the generation mix in these states. Although we have seen a lot of final investment decision (FID) announcements on grid-connected batteries, distributed storage remains a challenge. Given the current trend in rooftop solar growth, it is only a matter of time before the policy makers look to the distribution network for some system ramp mitigation mechanisms.
Tell myself a new day is rising
South Australia, however, is unique compared to other mainland states for a variety of reasons. The state currently:
- Has the lowest peak demand of all mainland states;
- Has the highest ratio of renewables in its generation mix;
- Has no coal generation in its generation mix, with a mixture of gas, and batteries (together with its interconnection to Victoria) covering all its flexibility needs.
With South Australia’s peak demand about 3 GW (about a third of the next lowest mainland state), the penetration of rooftop solar in the state has an amplified impact on operational demand. As seen in Figure 1 earlier, the gap between rooftop penetration and peak demand in South Australia is the tightest of all mainland states and it is only a matter of time before these two lines intersect – signifying a higher installed capacity for rooftop than peak demand in the state. As such, during spring season, when demand is typically lower and solar irradiance typically high, the impact of rooftop solar on operational demand in South Australia is clearly pronounced. The Australian Energy Market Operator (AEMO) had for a while predicted that South Australia was on track to have a zero (or negative) operational demand event. We have now witnessed a few of these events in South Australia and at the time of writing, the latest event of zero and negative operational demand in South Australia happened on 1 October 2023 (Figure 4).
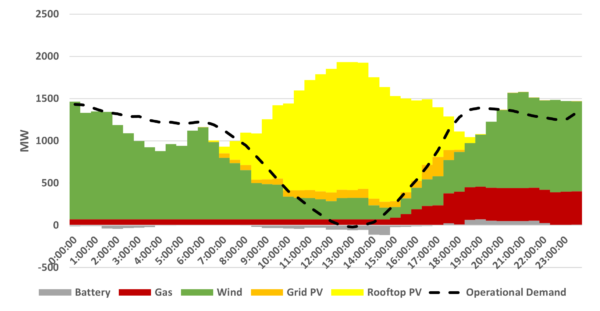
Image: Lumi Adisa
On this spring day in South Australia, the operational demand for the grid eventually went to zero (and below) around 1pm, with rooftop solar contributing a whopping 78% of the total generation. With demand at this level, all other generation was exported to the neighbouring state of Victoria with 6% from grid solar, 13% from wind and 4% from gas. Interestingly, despite being an expensive source of generation and not being in the merit order during this period, 70 MW of gas generation was instructed on by the market operator for system security purposes due to the high penetration of renewables. Noteworthy is the utilisation of a few grid batteries as well during this event as they were taking advantage of the excess supply to charge their assets.
The focus of this piece has been on operational demand, the impact of this phenomenal growth of rooftop solar, however, goes beyond demand.
Want you to know just where I stand
With these levels of embedded rooftop generation, market prices are also severely impacted especially during the typical spring day. Instances of negative pricing are exacerbated during spring stemming from an oversupply of low-cost renewables and lower-than-usual operational demand.
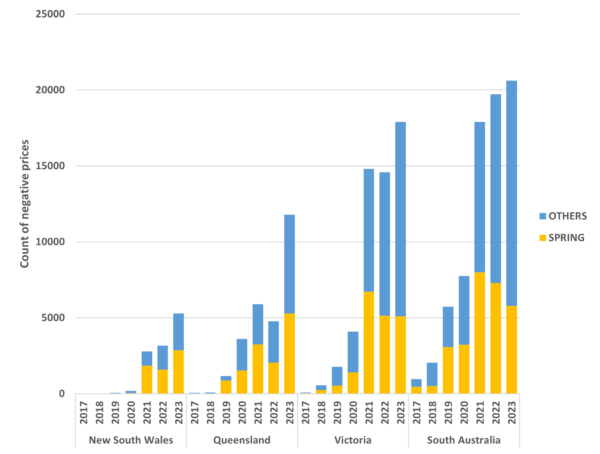
Image: Lumi Adisa
As seen in Figure 5, instances of negative pricing have increased over the past six years in mainland states. In fact, across all mainland states, 2023 has already broken the count record for negative prices even with two months to go. Unsurprisingly, a majority of these negatively priced periods have occurred in spring. This year, spring season already accounts for a third to over half of the total negative pricing seen in mainland NEM. Interestingly, New South Wales barely had any negative pricing until about three years ago; the rise in these pricing events coinciding with the phenomenal rise of rooftop solar in the state as seen in Figure 1.
The key question here, however, is: What correlation – if any – is there between rooftop solar and negative pricing events? As shown in Figure 6, seasons with high solar irradiance (summer and spring) show a higher percentage of underlying total demand met by rooftop solar in all mainland NEM states. However, as also seen in the figure, these seasons also accounted for the highest counts of negative prices in these mainland NEM states. Spring, in particular, displays the clearest correlation between rooftop solar penetration and negative pricing events. In 2023, the first two months of spring have collectively accounted for about 35% of the negative prices seen in mainland NEM, with rooftop solar averaging around 15% of total underlying demand. Nevertheless, rooftop solar is only a factor in driving negative pricing with other factors such as energy yield from grid-connected renewables and inflexibility of coal generation also playing a role in these pricing outcomes.
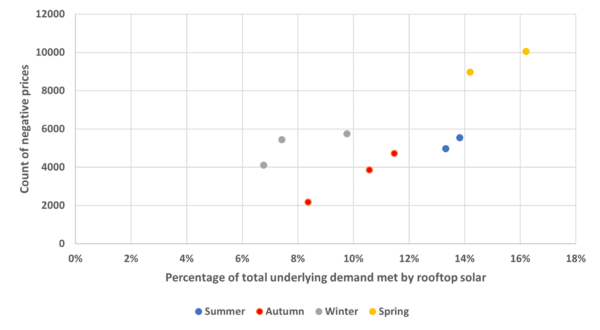
Image: Lumi Adisa
Today could be your lucky number
Policy makers have attempted to reduce the impact these large power exports from homes is having on the grid. For example, in South Australia, starting this financial year, policy makers have introduced a new rule requiring all new rooftop systems to install a new inverter control technology which unlocks the ability for exports to the grid from these systems to be remotely ramped up and down as needed by the grid. In other states, such as Queensland, some distribution network providers are exploring the possibility of switching off these exports all together as opposed to having flexible control of these rooftop solar systems.
Looking ahead, it is hard to see any slowing down of this phenomenal growth in rooftop solar capacities across the mainland states in the NEM. With much of Australia’s coal-dominated generation set to retire over the coming decade, in addition to the existing government incentives, it is expected that price increases that typically come with these retirements will only contribute to the uptake of rooftop solar as consumers look to reduce their power bills.
This changing energy supply mix towards cleaner technologies, as well as the changing intraday demand shape driven predominantly by rooftop solar uptake is expected to drive increasing flexibility needs in the coming years. The extent to which this leads to a large uptake of distributed and/or community battery storage systems is left to be seen. Encouragingly, we are beginning to see a slightly higher uptake of grid-scale battery storage technologies with some innovative project financing underpinning their development.
It is clear that there is much for the global power community to learn from Australia in this area of rooftop solar connections and its impacts on power grids. For example, NEOM, a city with a 100% renewable energy ambition, has the advantage of building its system from scratch, and as a consequence, implement a robust strategy for Distributed Energy Resources (DER) from the get-go in its central planning and design. When planned well, DER such as rooftop solar can have very positive impacts on power systems. For example, DER resources can keep the lights on for critical businesses (such as hospitals) during a major outage event to a transmission line.
In conclusion, Australia’s unprecedented growth in rooftop solar connections illustrates how quickly power grids around the world are evolving through DER, and the potential we have as a global power community to harness them for our good; we simply need some flexibility in thinking through its associated challenges.
–
*Data in charts current as of October 23, 2023.
About the author: Lumi Adisa
Lumi works as the Director for Energy Market Analytics at ENOWA NEOM. His team is responsible for planning and forecasting the demand and supply mix in NEOM – an upcoming city aiming to match its demand through 100% renewable supply. Vastly experienced in energy market modelling, design, and advisory, Lumi has been involved in many complex energy market projects. At the Australian Energy Market Operator (AEMO), he led the development of the proof-of-concept models for the Inaugural Integrated System Plan 2018 (ISP 2018). Lumi has also worked with large investors including Octopus Investments Australia where he was the Investment Director – Head of Energy Markets prior to joining NEOM in Saudi Arabia. Lumi trained as a mathematician with a PhD in applied mathematics from the University of Adelaide with the core of his thesis focusing on modelling energy storage using nanotechnology.
The views and opinions expressed in this article are the author’s own, and do not necessarily reflect those held by pv magazine.
This content is protected by copyright and may not be reused. If you want to cooperate with us and would like to reuse some of our content, please contact: editors@pv-magazine.com.


By submitting this form you agree to pv magazine using your data for the purposes of publishing your comment.
Your personal data will only be disclosed or otherwise transmitted to third parties for the purposes of spam filtering or if this is necessary for technical maintenance of the website. Any other transfer to third parties will not take place unless this is justified on the basis of applicable data protection regulations or if pv magazine is legally obliged to do so.
You may revoke this consent at any time with effect for the future, in which case your personal data will be deleted immediately. Otherwise, your data will be deleted if pv magazine has processed your request or the purpose of data storage is fulfilled.
Further information on data privacy can be found in our Data Protection Policy.