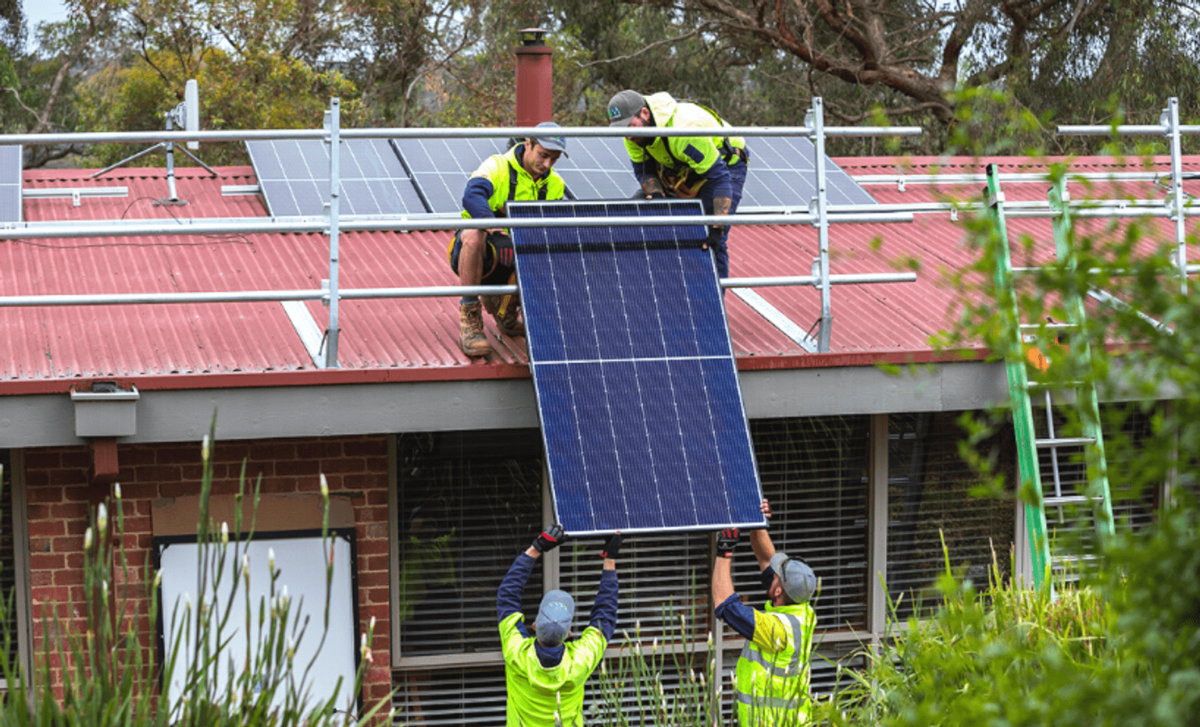
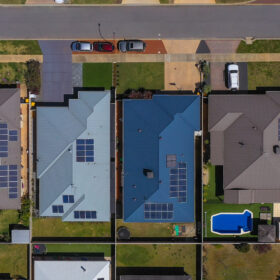
Australia now leads the world in per capita household solar, with more than 4 million homes – approximately one in three – equipped with solar panels[1].
This release includes household solar electricity generation in the Australian National Accounts (ANA) for the first time. Our new approach provides a more complete picture of the role of households in the electricity industry – as a producer, income earner, and a consumer.
This article explains the conceptual treatment of household solar electricity generation in the ANA. It then provides insights into investment in solar panels and solar electricity production followed by a more detailed analysis of household electricity consumption.
Key Findings
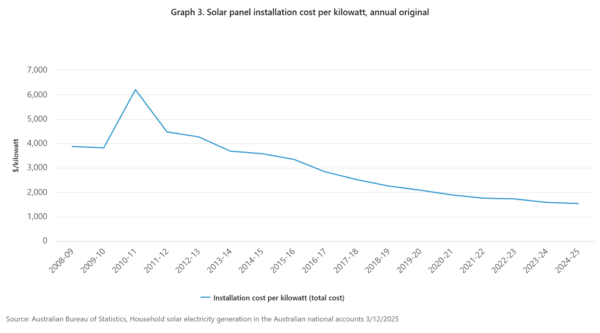
- Rooftop solar installation costs per kW of installed capacity fell 75% from 2010-11 to 2024-25 driven by better technology and large-scale production.
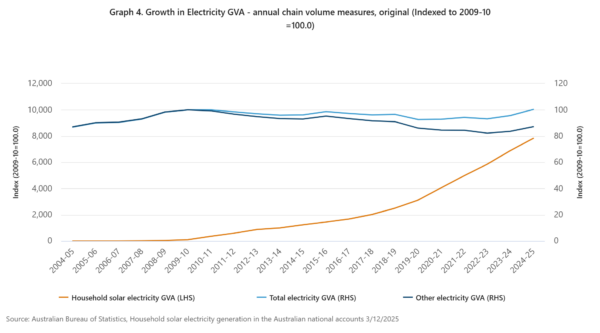
- Household solar electricity generation increased 20-times over the same period and now accounts for approximately 8% of total economy-wide electricity generation.
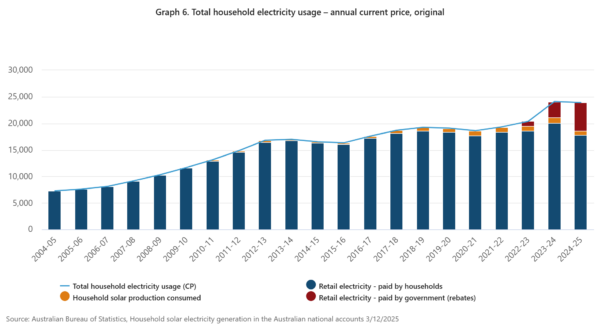
- Households consumed almost $24 billion (USD 15.9 billion) of electricity in 2024-25 – $23 billion supplied by retailers and $1 billion supplied by rooftop solar.
- Of the $23 billion supplied by retailers, $18 billion was paid by households and $5 billion by government rebates.
- Retail electricity prices have doubled since 2009-2010 to be $0.29 / kWh in 2024-25.
- The average feed-in-tariff – the price used to value rooftop solar – halved over this same period to be $0.06 / kWh.
- Over the past year, the average price paid for electricity (including the implicit price of solar) fell 1.4%, while the retail price rose 0.4%.
- In aggregate, in 2024-25, the household sector saved just over $3 billion or $125 per capita on electricity costs by installing rooftop solar.
Concepts
When households undertake productive activity, the ABS treats them as small businesses (unincorporated enterprises) for accounting purposes. This enables us to measure and count their economic contribution properly.
This approach is applied in the ANA to measure housing services. When you own your home, the ABS calculates what you would pay if you rented it. That imputed rent is treated as if you are running a small business – you are producing a housing service (and consuming that service). The same logic now applies to solar electricity.
Rooftop solar panels owned by households for electricity production will now be treated as a distinct asset class, separate to the dwelling they are attached to.
These panels are classified as investment in machinery and equipment and are generally sourced from overseas (recorded as imports). This reclassification resulted in no change to total private investment. The dwelling (excluding the roof top solar panels) that produces housing services is separately classified as investment in dwellings.
Solar electricity produced by these unincorporated enterprises contributes to the gross value added (GVA) for the Electricity, Gas, Water and Waste Services industry.
This includes electricity consumed by the household and any surplus sold to the grid. Electricity consumed by the household is recorded as household final consumption expenditure (HFCE) of Electricity, Gas and Other Fuels. Income generated from household electricity production is captured as gross mixed income. Income includes the surplus exported to the grid and imputed income from the amount consumed.
Summary Diagram – Household solar electricity generation
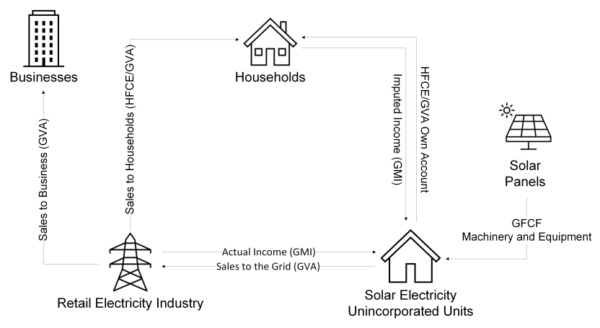
Household solar generated electricity is priced using the Feed-in Tariff (FiT) rate – the price households receive when selling excess solar to the grid. This represents both the market price for surplus electricity and the opportunity cost of consuming it directly (i.e., the household could choose to sell all the solar generated electricity it produces). Retail electricity prices are not appropriate as they include costs borne by the retailers, including distribution charges, taxes and retailer margins.
Insights into household solar electricity generation in the Australian economy
Household installation of solar panels
To encourage households to install rooftop solar systems, the Australian Government introduced its first rebate program in 2000. Rebates continued over the years and by 2011, the Small-Scale Renewable Energy Scheme was introduced. This initiative reduced the average out-of-pocket costs of installation by 50%. In 2024-25, the scheme covered over 40% of total installation cost[2].
To further incentivise households to move towards renewable energy, state and territory governments introduced Feed-in-Tariffs (FiT), assisting households in recouping some of the remaining costs.
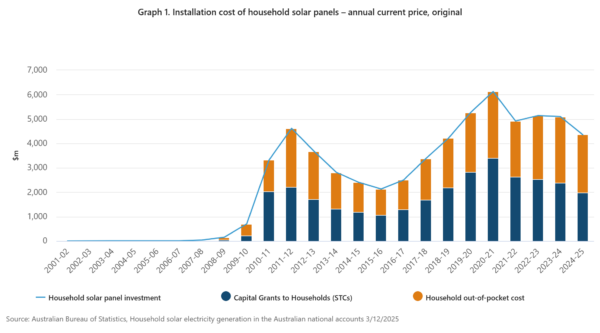
During the COVID-19 pandemic, as households spent more time at home and electricity consumption surged, rooftop solar panel installations reached a record high.
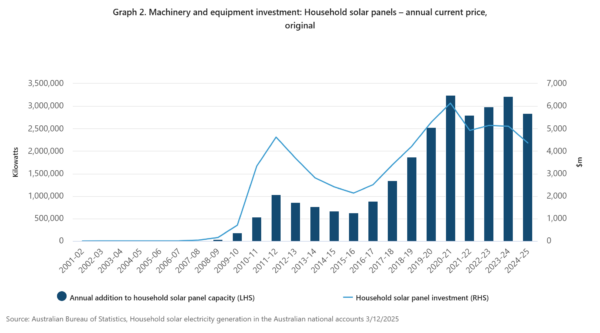
Household solar electricity production
Over the past 15 years, Australia’s electricity industry has been transitioning from reliance on large-scale, aging coal powered electricity generators to an increasing share of renewable energy sources including wind, solar and hydro. Household solar electricity generation has expanded markedly, while generation from traditional sources, driven mainly from coal powered generation has slowly declined.
Over the past 15 years, household solar electricity generation has increased 20-times and now accounts for 7.6% of total economy-wide electricity generation.
Household electricity consumption
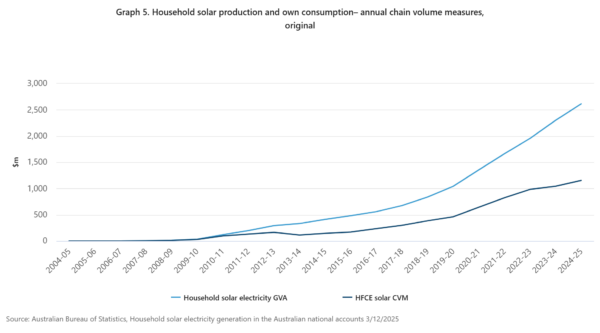
The incorporation of household solar generation in the ANA has expanded the coverage of electricity within the Electricity, gas and other fuels consumption category, resulting in an increase in total HFCE and GDP (E).
Household electricity consumption patterns are influenced by competing factors including changing weather patterns, energy efficiencies, solar generation, and electricity costs. Whilst household solar generation has continued to rise, households consume only about 50% of their electricity production.
In the evenings and early morning, when electricity demand is high, and solar production is low, households remain reliant on energy retailers to meet electricity demand. The ANA does not currently capture batteries used to store solar generated electricity. This share of consumption of household solar production is likely to change as households invest in solar electricity batteries as they become more affordable (due to a decline in costs and government subsidy programs) and efficient.
In 2023-24, the Commonwealth government, jointly with State and Territory governments, launched the national Energy Bill Relief Fund (EBRF). The EBRF reduced electricity bills for households and small businesses, and has extended and expanded into 2025-26, with additional State and Territory government specific funds.
These rebates are classified in the ANA as social transfers in kind, measured as government consumption on behalf of the household. Therefore, electricity consumption via rebates does not contribute to HFCE.
For analytical purposes, electricity consumption undertaken by government on behalf of households via rebates has been added to HFCE to represent households’ actual electricity usage.
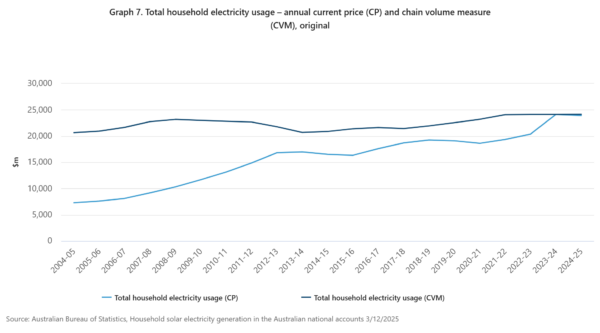
In 2024-25, the total value of electricity usage by households was $23.9 billion, electricity retailers provided $23.1 billion (of which households paid $17.8 billion and $5.4 billion was covered by government rebates) and $798.8 million from household solar generation.
On average, household electricity usage rose 3.3% per year over the last decade in nominal terms, reflecting consistent price rises. In contrast, average growth in real terms (1.4%) was lower, in line with average annual population growth (1.5%).
Household electricity prices
Household electricity prices are influenced by multiple factors including the global spot price for thermal coal and gas, distribution costs and any supply disruptions to the market. As remaining coal powered plants have been subject to outages, there has been increased need for more expensive gas-powered generation to meet demand.
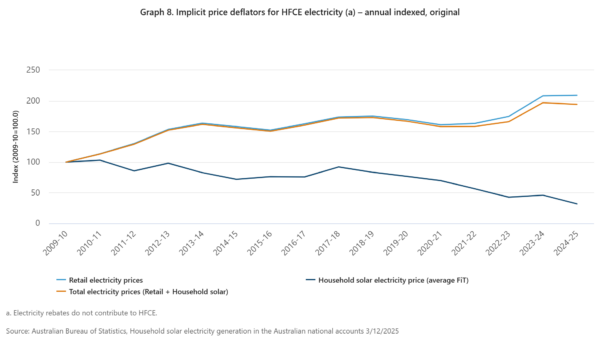
Image: Australian Bureau of Statistics
Overall, higher distribution costs and supply constraints in the retail electricity market drove the rise in electricity prices. Retail electricity prices have doubled since 2009-10, with an estimated price of $0.29/kWh in 2024-25[3]. The average FiT rate has halved over the same period to be $0.06/kWh in 2024-25.
From 2023-24 to 2024-25, the average retail electricity price rose 0.4% while the average price paid by households for electricity, which includes the implicit price of solar, fell 1.4%.
Household consumption of own account solar electricity – what if? scenario
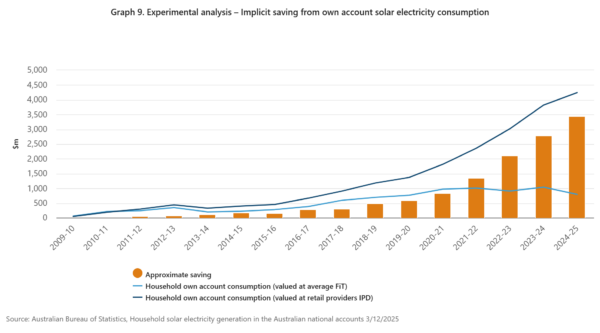
The widening gap between the average cost of solar and of retail electricity provides increasing savings to households with rooftop solar. This part of the analysis estimates the size of these savings assuming no change to consumption behaviour.
To model an implicit saving to households, household consumption of solar electricity was calculated using both retail prices and FiT rates. Solar consumption quantities (in kWh) were multiplied by retail prices and compared the same quantities valued at FiT rates. This comparison shows a rapid increase in annual saving over time, with a saving of $3.4 billionfor the household sector or $125.74 per capita in 2024-25.
State and Territory solar electricity consumption
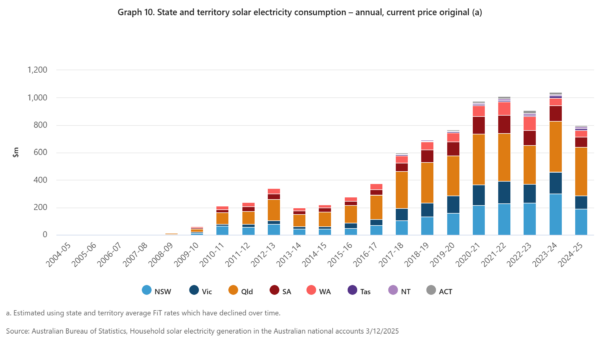
Image: Australian Bureau of Statistics
Queensland and New South Wales account for half of the rooftop solar in Australia and consume the highest amount of solar electricity[4]. Despite having a lower population than New South Wales and Victoria, Queensland benefited from its first solar bonus scheme in 2008[5], coupled with a sunny climate. These favourable conditions have seen Queensland maintain its lead in solar electricity consumption. In response to oversupply of household solar electricity to the grid, most states and territories recorded falls in the FiT rates for 2024-25, led by NSW falling to $0.05/kWh.
Explainer – Differences between HFCE implicit price deflator (IPD) and the CPI [6]
Household solar consumption is included in HFCE within the National Accounts. The average FiT rate is used to value solar electricity and is much lower than retail electricity prices. Therefore, the inclusion of solar consumption reduces total HFCE electricity IPD.
Electricity rebates are treated in the National Accounts as government consumption, social transfers in kind on behalf of households. The HFCE electricity IPD fell 1.4% in 2024-25.
In contrast to the National Accounts, the CPI does not include solar electricity generation consumed by households. Household solar electricity consumption will have an indirect impact on the CPI when households consume electricity from their solar panels rather than purchasing it from retailers.
This will reduce the weight assigned to household expenditure on electricity purchased from electricity retailers in the CPI. The CPI includes electricity rebates as a reduction in out-of-pocket expenses to consumers. The CPI for electricity fell 14.7% in 2024-25 (year-on-year average).
The annual price of HFCE electricity fell 1.4% in 2024-25, compared to the 0.9% fall in the CPI of electricity excluding rebates (year-on-year average). The difference captures the price effect attributable to household solar electricity in the National Accounts.
Footnotes
- Australia hits rooftop solar milestone | energy.gov.au
- Searching for public benefits in solar subsidies: A case study on the Australian government’s residential photovoltaic rebate program – ScienceDirect
- Estimated using sales and usage data sourced from ABS Survey of Consumer Sales (SOCS).
- Rooftop solar and storage biannual report | Clean Energy Council
- Queensland Solar Bonus Scheme – Policy Guide March 2023
- The 2024-25 annual CPI figure is calculated as the movement of the average of the four quarters in 2023-24 compared to the average of the four quarters in 2024-25. In the CPI publication, annual estimates are calculated as the 12 month movement to the reference month.
The views and opinions expressed in this article are the author’s own, and do not necessarily reflect those held by pv magazine.
This content is protected by copyright and may not be reused. If you want to cooperate with us and would like to reuse some of our content, please contact: editors@pv-magazine.com.


By submitting this form you agree to pv magazine using your data for the purposes of publishing your comment.
Your personal data will only be disclosed or otherwise transmitted to third parties for the purposes of spam filtering or if this is necessary for technical maintenance of the website. Any other transfer to third parties will not take place unless this is justified on the basis of applicable data protection regulations or if pv magazine is legally obliged to do so.
You may revoke this consent at any time with effect for the future, in which case your personal data will be deleted immediately. Otherwise, your data will be deleted if pv magazine has processed your request or the purpose of data storage is fulfilled.
Further information on data privacy can be found in our Data Protection Policy.