Nikhil Vadhavkar, co-founder and CEO of Raptor Maps, creators of AI-enabled solar-asset-inspection software, says that when he compared recent detection of faults on Australian solar farms to Raptor’s world average of 1.7%, for pv magazine, “We expected that with what we’re seeing in terms of construction and warranty claims that Australia might be significantly higher in terms of affected capacity.”
In fact, he says that although newer sites, usually within the warrantable EPC period, show a high number of defects, this is counterbalanced by sites that have ironed out any construction issues and have progressed beyond the two-year warranty phase.
“So, on average, there’s more variability, in Australia, but Australian plant doesn’t have a much higher incidence of defects,” says Vadhavkar, and once initial issues have been addressed, “Australian sites are well run.”
Raptor Maps arrived at the world-average figure of 1.7% of capacity affected by defects, faults or site issues, through aggregated data from 2,900 MW of solar installed across 18 countries, which it analysed for a report published early this year.
Getting granular on global PV data
The 2019 Global solar aerial thermography report, summarised data from the previous 12 months to find row and string faults were causing the biggest drain on production. This was defined as where an entire row was found to be offline or not aligned with its inverter or combiner section; or a string was offline or significantly warmer than surrounding strings.
The second most commonly identified cause of power loss was inverter sections discovered to be offline or significantly warmer than the site average. Other categories of fault identified by aerial thermography included incorrect tilt of tracking mechanisms relative to the sun; delamination or cracking of the glass surface of modules and overheating of individual cells.
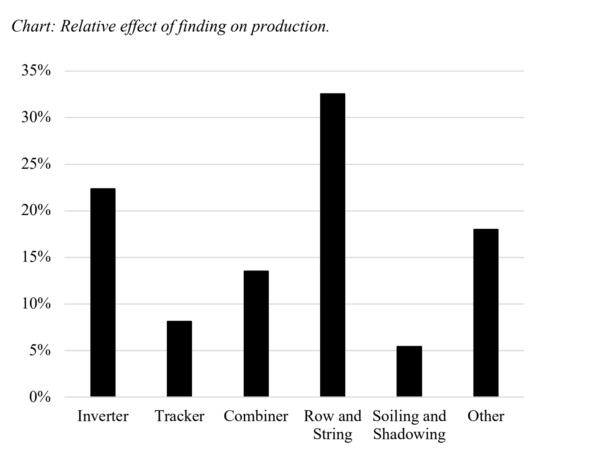
Graph: Raptor Maps
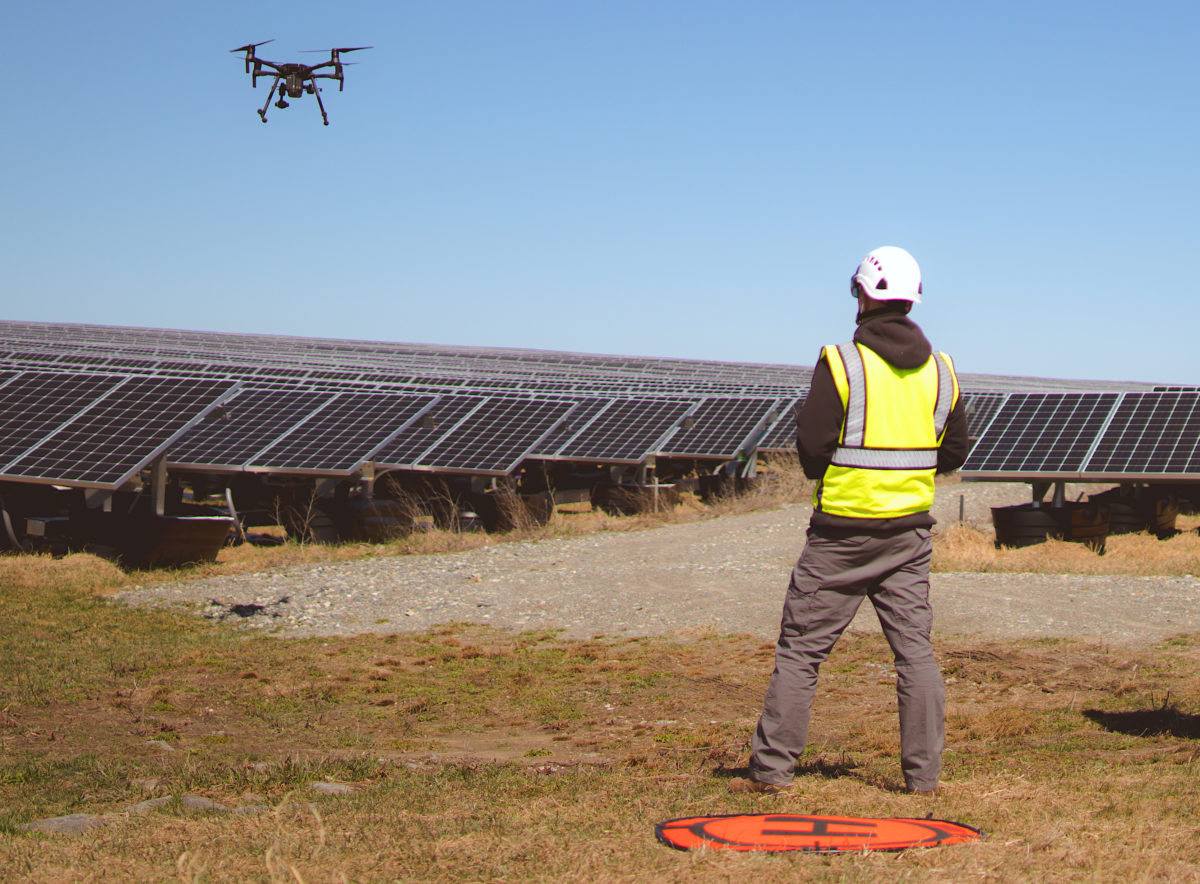
Local UAS operators fly with Raptor
Boston, US-based Raptor Maps has had a presence in Australia since late 2018 and since then has trained four drone service providers (with several more currently undergoing training) in how to gather data that conforms to standards which can be analysed by Raptor Maps software. Its model of partnering with in-country unmanned aerial systems operators in best practices and the generation of comparable data has brought more than 7 GW of solar under Raptor surveillance worldwide.
The company’s correlation of high-resolution infrared and high-resolution colour imaging identifies the location of electrical faults and failures, with an overlay that shows vegetation, soiling and other visible causes.
“It’s the difference between saying, ‘There’s a hotspot. What does it mean?’ and identifying, ‘There’s heating here due to vegetation overgrowth,’ which is immediately actionable”, says Vadhavkar.
A new series of videos and webinars produced by FLIR imaging systems and Raptor Maps on the use of thermal drones for solar inspection was published online last Friday. It describes how aerial thermal imaging can enhance the traditional method of manual electrical inspection, known as I-V curve tracing, by accelerating data collection and subsequently focusing skilled technicians on inspection of identified hotspots.
Fast aerial mapping supports targeted deployment of technicians
Conducting manual electric testing at ground level on individual module strings can take several days on a large solar installation. With aerial thermography, says Austin Coffin, Head of Sales at Raptor Maps, “You can scan several hundred acres within a single day… site management has a better ability to understand where to deploy their field technicians in a more efficient way … and informed by thermal and colour imaging, technicians are then “better prepared for the work that needs to be performed”.
Vadhavkar says Raptor Maps’ global average impact in identifying restorable production is around 2% revived capacity.
“And then in terms of cost reduction on general operations and maintenance, I’ve heard our customers quote savings of 48%.” However, he says that far from replacing technicians, automated solar-farm inspections allow customers “to just keep up” with the need for monitoring, fault restoration and maintenance in the rapidly growing solar PV industry.
Assessing financial impacts enables informed decisions
Updates added to the Raptor Maps system late last week include a portfolio-management dashboard that allows PV plant financiers, owners and operators to assess the financial impact of losses and remediation over time, on one solar farm or a portfolio of solar farms. Such data can help owners to refine allocation of resources to solar farm maintenance, and reveal the impact of design differences on performance and rate of failure.
“That’s something you can’t do with a stack of engineering reports,” says Vadhavkar, “but using software and a good data model of every solar farm, you can start to unlock these capabilities.”
Raptor Maps also has a construction-site-progression product live across several sites that are in the build phase. Aimed at EPCs, the software allows quantitative tracking of installation progress, comparison with construction plans, and provides objective documentation to owners and financiers.
Real-time data-based construction management
Demand for the construction-phase extension has been “incredible” says Vadhavkar. Understandably, he says, during construction, various contractors are keen to complete their work and move on. “You have a very narrow window to make a decision: sign off on their work and pay them, or provide definitive proof of what they need to fix before you will sign off.” Recalling contractors to make good on errors or misunderstandings when they’ve already moved on takes time and causes delays that can be avoided with “real-time, quantitative proof of work carried out relative to design drawings”.
Vadhavkar expects Raptor Maps will have an Australian base of 1GW of solar assets under monitoring by the end of 2019. Although non-disclosure agreements prevent him naming the solar farms currently served by Raptor Maps software, he says several of the utility-scale projects are at least partly funded by the Clean Energy Finance Council which requires high standards of reporting.
“People are starting to value transparency,” says the Raptor co-founder. “Nobody benefits from sweeping problems under the rug. Operators who are transparent with their customers and their investors are the ones who will build essential trust.”
At the same time, he says that in a young industry, “People don’t yet know what they don’t know,” says Vadhavkar. “We’re trying to think long term and identify how we can improve current projects and make the entire solar asset class more investable.”
This content is protected by copyright and may not be reused. If you want to cooperate with us and would like to reuse some of our content, please contact: editors@pv-magazine.com.


1 comment
By submitting this form you agree to pv magazine using your data for the purposes of publishing your comment.
Your personal data will only be disclosed or otherwise transmitted to third parties for the purposes of spam filtering or if this is necessary for technical maintenance of the website. Any other transfer to third parties will not take place unless this is justified on the basis of applicable data protection regulations or if pv magazine is legally obliged to do so.
You may revoke this consent at any time with effect for the future, in which case your personal data will be deleted immediately. Otherwise, your data will be deleted if pv magazine has processed your request or the purpose of data storage is fulfilled.
Further information on data privacy can be found in our Data Protection Policy.