
Curtailment, connection delays, marginal loss factors, an inadequate electricity transmission system, the ongoing Federal energy-policy vacuum — the list of considerations and potential detractors from the solar developer’s bottom line is ever expanding. New calculations by energy analysts Cornwall Insight now find that solar farms are disproportionately shouldering the growing cost of providing frequency control ancillary services (FCAS) in the National Electricity Market (NEM).
Cornwall Insight reports that solar farms pay between 10% and 20% of total regulation FCAS costs in any given month, when at this stage they produce only around 3% of energy generated in the NEM. In comparison, wind farms provided some 9% of energy in the NEM during the financial year 2019-20 (FY20), and their cumulative FCAS causer pays tally came to around 10% of total regulation costs.
The “causer pays” factor refers to how much any generator deviates from their linear ramp rate to meet their next energy dispatch target for each dispatch period.
“A new operational consideration for renewables is the liability that high regulation FCAS prices pose to the profitability of current and future renewable energy projects,” says Ben Cerini, Principal Consultant at Cornwall Insight Australia.
The company’s research found that FCAS causer pays costs for grid-scale solar generators are conservatively around $2,368 per megawatt each year, or around $1.55/MWh, although this varies across NEM regions, with Queensland solar farms having higher causer pays factors in FY20 than those borne in other states.
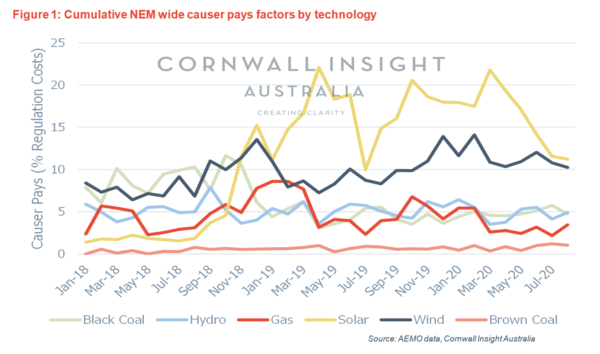
Image: Cornwall Insight Australia
Cerini notes, “Since 2018, regulation FCAS costs have fluctuated between $10-$40 million a quarter. Q2 of 2020 was a relatively small quarter by recent comparisons, at $15 million with the last three quarters before that more than $35 million a quarter.”
Separation anxiety takes its toll
Deploying FCAS allows the Australian Energy Market Operator (AEMO) to manage deviations in generation or load. The main contributors to the very high FCAS costs of Q1 this year were three unexpected “separation” events: when multiple transmission lines in southern NSW tripped as a result of the bushfires, separating northern from southern regions of the NEM on January 4; the most costly separation, when South Australia and Victoria were islanded for 18 days following a storm that crippled transmission lines on January 31; and the separation of South Australia and western Victoria’s Mortlake Power Station from the NEM on March 2.
When the NEM operates as a connected system FCAS can be sourced from throughout the grid, allowing AEMO to call on the cheapest offers from providers such as generators, batteries and loads. During separation events, FCAS must be locally sourced, and in the case of the 18-day separation of SA and Victoria, it was met by increased supply from gas-fired generation.
As a consequence, NEM system costs in Q1 were $310 million, of which a record $277 million was chalked up to FCAS needed to maintain grid security in these extraordinary circumstances.
The return to a more typical system costs tally of $63 million in Q2, of which FCAS made up $45 million, was “primarily due to the lack of occurrence of major power system separation events”, said AEMO in its Q2 2020 Quarterly Energy Dynamics report.
Large-scale solar contributes to reduced wholesale electricity costs
At the same time, Q2 2020 saw the average regional wholesale electricity spot prices reach their lowest levels since 2015; and 48-68% lower than they were in Q2 2019. AEMO listed the contributing factors to reduced wholesale price offers as: “lower gas and coal prices, easing of coal constraints at Mount Piper, increased rainfall (and hydro output), and new renewable supply”.
Grid-scale variable renewable energy output (wind and solar) increased by 454 MW in Q2 2020, accounting for 13% of the supply mix, up from 10% in Q2 2019.
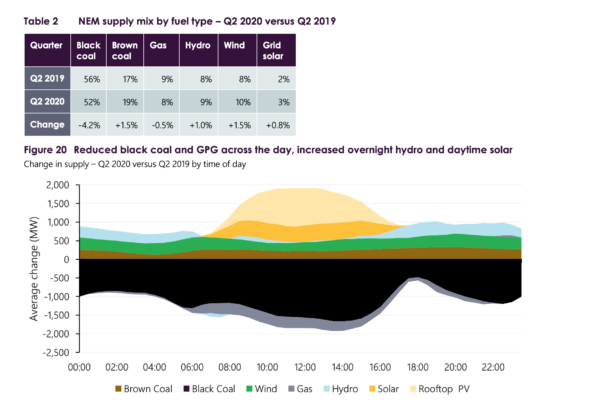
Image: AEMO
Lowest-cost renewable energy will only increase its contribution to reducing wholesale energy prices; and a more distributed and strengthened web of interconnected transmission, along with revised rules governing battery connection in the NEM, hold the key to ensuring access to competitively priced FCAS as needed.
In the meantime, Cerini says developers and investors are closely monitoring any increased risks to project costs: “As wholesale prices have fallen, potential power purchase tenures have shortened, and loss factors have fluctuated,” he explains.
Cornwall Insight has flagged its intention to provide FCAS price forecasting starting in September 2020, although the kinds of events which caused FCAS to spike in Q1 are hard to anticipate.
Nonetheless, Cerini says, “FCAS liabilities are now firmly on the due diligence agenda.”
This content is protected by copyright and may not be reused. If you want to cooperate with us and would like to reuse some of our content, please contact: editors@pv-magazine.com.


Natalie, in your article you write:
‘ solar farms are disproportionately shouldering
the growing cost of providing frequency control
ancillary services (FCAS) in the National Electricity
Market’
Unfortunately, I suspect that some readers might (mistakenly?) read ‘disproportionately’ as ‘unfairly’.
In a growing series of Case Studies via WattClarity we’re investigating the number of extreme instances where aggregate Raw Off-Target values across all Semi-Scheduled plant (most Wind and Large Solar) has escalated markedly since late in 2018:
http://www.wattclarity.com.au/articles/2020/07/semischeduled-aggrot-extrapolation/
It seems likely that these increasing imbalances will be one of the drivers of increasing amounts of FCAS being procured in future (and possibly other implications as well).