Australia’s energy transition is a complex, heaving beast. Predictions about the role and performance of renewable energy are rightly sunny, but we can’t always foresee how the beast, when seared by solar, or poked by wind turbines, or reined in by market conditions, will behave in the short to medium term. Analysis of the recent past lets the industry recalibrate, adjust expectations, and correct without over-correcting on the road to a renewable National Electricity Market (NEM).
Global-Roam and Greenview Strategic Consulting’s Generator Statistical Digest (GSD2020) is today available in its second annual iteration — an update to the benchmark Generator Report Card 2018.
According primarily to daily data made available by the Australian Energy Market Operator (AEMO), it shows how different generators performed in the NEM in 2020, and up to 10 years previously — depending how long they’ve been in operation.
The GSD2020, a trove of information that also correlates data from the Bureau of Meteorology and other sources, can be downloaded for a fee, but energy market analysts also publish insights from the data on Global-Roam’s industry-facing website, WattClarity.
For them, last year’s data highlighted at least two important contradictions:
- The volume of energy generated from renewables last year was lower than might be expected from a bonanza of new generators entering the NEM.
- Gas generation, touted years ago as the transitional technology between coal-fired generation and renewables, is falling off the edge of the renewables boom, pushed by lowest cost renewables, and competitive coal.
Annual average capacity factor down on expectations
Last year was the biggest yet for utility-scale variable renewable energy (VRE), with around 3.5 GW of new renewable projects added to the NEM, which, writes ITK power market analyst Ben Willacy, boosted fully operational renewable capacity over the 10 GW mark.
The GSD2020 allows comparison of each generator’s annual average capacity factor — the amount of energy produced as a percentage of its full-capacity potential if it were to operate 24 hours a day, 365 days a year — with its actual output.
So it’s never going to be 100%, but when Global-Roam published the Generator Report Card 2018, Willacy made informed assumptions of a solar capacity factor of around 30% for Queensland and 26-28% in other states.
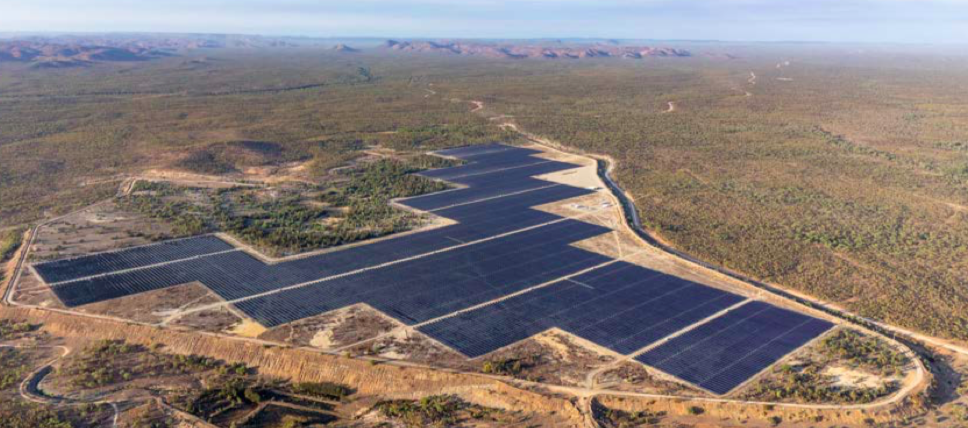
“It’s clear this hasn’t happened,” he writes, citing GSD2020 data on Edify’s Whitsunday Solar Farm near Collinsville in North Queensland, which produced 110,000 MWh from 56 MW capacity in 2020 — a capacity factor of a mere 22%.
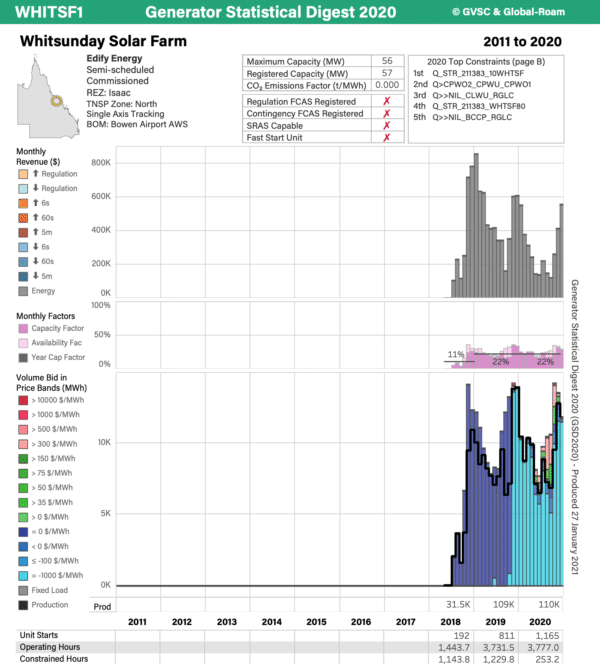
Image: Global Roam and Greenview Strategic Consulting
Overall, Willacy calculates from the data that solar farms in the NEM achieved an average 23% capacity factor in 2020.
Given that Queensland has around 1.5 GW of fully operational utility-scale solar, the 7% loss on an expected 30% capacity factor equals almost 1 TWh per year, or the equivalent of a 450 MW solar project.
“That’s an entire Western Downs Solar Farm that’s gone missing,” he writes.
Remarkably, this puts the federal Renewable Energy Target — which pundits were sure would be shoo in given the capacity installed in 2020 — in a tight spot!
Willacy says there are a variety of reasons for the shortfall on expectations. He posits that two of the main culprits are curtailment: that’s economic curtailment, self imposed by generators when the market price for energy drops below zero; and restrictions on output imposed by AEMO in response to technical constraints of the grid.
“We expect system constraints to ease over time, as transmission investments are made,” he writes, “But economic curtailment may become more prevalent as the number of negative price intervals increases, at least over the near term.”
Although widespread integration of storage assets is likely to “help with both issues”, says Willacy, solar will continue to be disproportionately affected by negative pricing.
He believes the renewables industry “may need to stick with a more conservative set of capacity factor assumptions”, until the storage cavalry arrives, with its ability to distribute generation over the energy demands of any day day.
Solar farms that bucked the lower-than-expected output trend: Kidston solar farm in Queensland hit the mark with a 30% capacity factor; and in New South Wales, Griffith and Parkes Solar Farms, among Neoen’s first developments in Australia, scored 29% and 28% respectively.
Gas unmasked!
There’s nothing like data for exposing truth, and ambiguities. Although crystal ballers around the year 2000 revved up gas as a “transition fuel”, and Prime Minister Morrison has more recently also hit the gas with support for the industry and statements such as, “there is no credible energy transition plan for an economy like Australia that does not involve the greater use of gas …” GSD2020 shows that investments in gas generation may have peaked too early.
On WattClarity independent energy markets consultant Allan O’Neil analyses the generation over time of seven gas-powered generators located across the NEM states, focusing on those using the more efficient combined-cycle gas turbines (CCGT), and excluding open-cycle gas turbines.
Although three quarters of the 5.7 GW of gas fuelled generation commissioned in the NEM since 2007 has been the less efficient open-cycle technology, CCGT “was the technology principally expected to mitigate emissions under that early view of the energy transition” writes O’Neil, and as such warrants a closer look.
The trend has been for most of those power stations — Darling Downs and Swanbank in Queensland, Tallawarra in NSW, Newport (the closest thing Victoria has to CCGT generation), and Torrens Island B in Adelaide — to become much less consistent in their running schedules, showing lower utilisation over the past five or six years as renewable generation increased its penetration of the NEM.
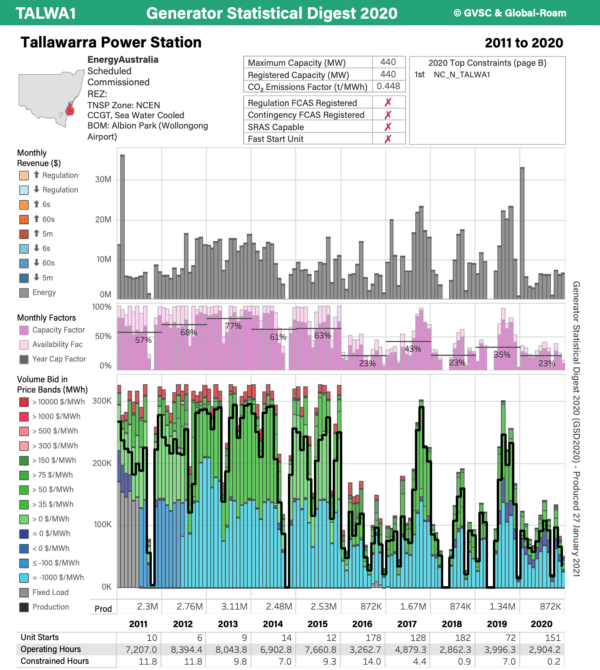
Image: Global Roam and Greenview Strategic Consulting
Changes in overall NEM generation output show that since 2015 annual brown coal generation has significantly decreased, while black coal generation has barely changed, renewables have shown a leap in contribution with solar up 262% (more than half of which is attributable to small-scale rooftop generation) and wind is up 95.2%. But natural gas generation has declined by more than 27%.
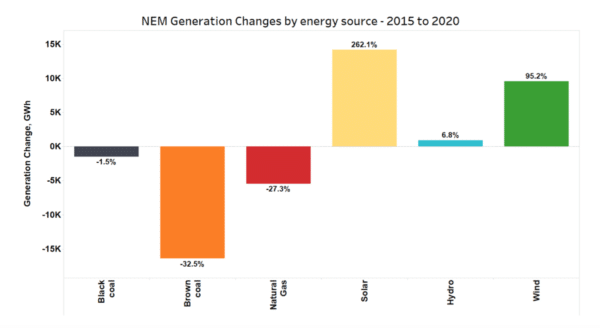
In short, although output lost from brown-coal-fuelled power stations has been more than replaced by renewables, gas has made no indent in black coal.
Writes O’Neil, “This probably isn’t the outcome expected by participants who invested in new gas-fired stations from the early 2000s onwards, expecting to benefit from gas’s ‘transition fuel’ status.”
He pins the blame for depressed utilisation of gas-fired stations on the sharp rise in natural gas prices from mid 2016, and says, “In the absence of any emissions pricing mechanism, coal-fired stations maintain a significant short-run cost advantage over gas.”
Although gas-fired reserve will continue to be called on to generate at peak times in a grid increasingly powered by renewables; and if coal-fired stations are retired ahead of schedule, gas may be expected to step up, O’Neil concludes, “It’s very hard to foresee a scenario where gas replaces coal as the NEM’s ‘workhorse’ primary energy source.”
The market will continue to steer this aspect of the transition, with gas tending to be squeezed out of the dispatch stack when renewable output runs high or demand for grid energy slumps.
In the meantime, many more analysts will mine the Generator Statistical Digest 2020 for insights and corrections. Watch this information ecosystem.
This content is protected by copyright and may not be reused. If you want to cooperate with us and would like to reuse some of our content, please contact: editors@pv-magazine.com.


All those reasons for the failure of the gas as transition fuel expectations are correct, however as gas has now fallen to about 5.5% of generation from around 12% in summer a few years ago, there is not much further for gas to fall. The new renewables coming on line over the next 4-5 years will have an expected capacity of 40 TWh per year and at current rates gas is only supplying about 10-12 TWh. So even after Liddell closes (8.5 TWh) and gas falls another 20% that is still a lot of coal generation to lose.
Even if 20% of the new renewables are curtailed the reduction in coal generation is still equivalent to two more Liddell’s worth of coal plant closures. In total one can expect black coal output to fall by about 30% over the next 5 years