From Lumi Adisa at Cornwall Insight Australia
In April, the NSW government opened consultations on “specific urgent and mechanical policy details” on regulations needed to implement its Electricity Infrastructure Roadmap released late last year. The Roadmap aims to unlock 12GW of new renewable energy capacity from selected Renewable Energy Zones (REZs) with an additional 2GW in storage by 2030.
In our Chart of the Week Issue 39 last June which highlighted the looming energy gap between retiring coal generators and growth of renewables, we predicted that the announcement of the Central West Orana (CWO) REZ was the first of many to come. A year on, that prediction has come true with the announcement of the Roadmap aiming to unlock even more REZs last November. In this Chart of the Week, we take stock of how this energy gap has evolved since last year, and we provide commentary on the likely impact the Roadmap will have on the market going forward.
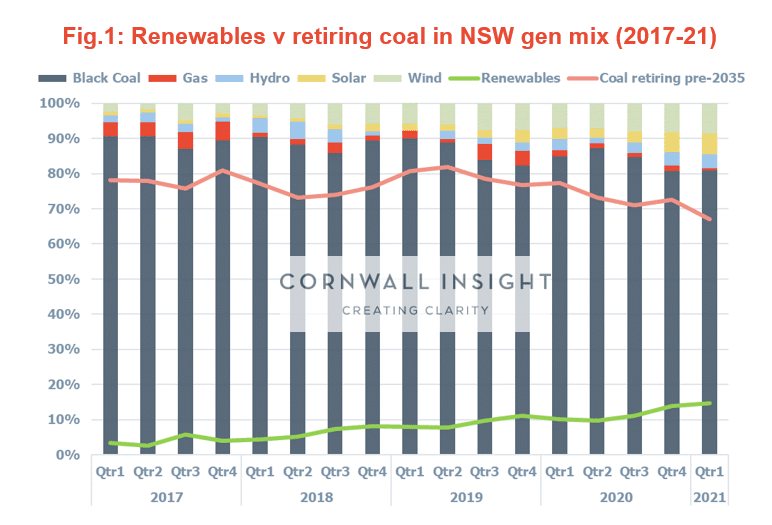
As shown in Figure 1, the contribution to the NSW generation mix from variable renewable energy (VRE) sources (wind and solar) have grown significantly in just a year (Q1 2020 to Q1 2021). In fact, Q1 2021 saw the largest year-on-year growth (5%) of VRE contribution to the state’s generation mix in the last 4 years. Not surprisingly, this same period also saw the lowest contribution from coal generators exiting the market in the next 10-15 years, dipping for the first time below 70% (~67%) of NSW’s local energy requirements. These trends suggest that the market transition is gathering pace in NSW with the growth gradient of VRE contribution to generation mix in the state looking strong.
Nonetheless, going forward, NSW as a state looks quite attractive for renewable investments given ~67% of the current generation sent-out from the state would have to come from somewhere else in the next 10-15 years. With VRE only currently making up ~15% of the generation mix in the state, significant new capacity (in addition to improved import capacity via new interconnectors) would have to connect in the next decade to replace the energy sent-out from these coal-fired power stations earmarked for retirement.
The key questions to then ask are: will the current retirement timelines hold true given the incoming Roadmap? And if they don’t, is the energy from these REZs sufficient as replacement to ensure reliability in the state? Simply put, were the Roadmap to go ahead in its current form, it is fair to expect that these coal units would exit the market earlier than expected, perhaps even in a disorderly manner? The answer to the second question however is slightly more complex given the weather dependency of VRE, the merchant outlook under the Roadmap, and the associated question of storage.
In Issue 78, we looked at the correlation of wind output across all REZs in the NEM. The identified REZs in the Roadmap exhibit varying degrees of wind correlation; CWO and New England showing the highest correlation factor (0.53) and New England and South West the lowest (0.32). This suggests wind projects under the Roadmap are more likely than not to contribute positively to reliability in the state. Exactly how this plays out – especially during extended VRE droughts – is of course left to be seen with storage (or new hydrogen/gas plants) likely to significantly influence this reliability outlook.
The views and opinions expressed in this article are the author’s own, and do not necessarily reflect those held by pv magazine.
This content is protected by copyright and may not be reused. If you want to cooperate with us and would like to reuse some of our content, please contact: editors@pv-magazine.com.


By submitting this form you agree to pv magazine using your data for the purposes of publishing your comment.
Your personal data will only be disclosed or otherwise transmitted to third parties for the purposes of spam filtering or if this is necessary for technical maintenance of the website. Any other transfer to third parties will not take place unless this is justified on the basis of applicable data protection regulations or if pv magazine is legally obliged to do so.
You may revoke this consent at any time with effect for the future, in which case your personal data will be deleted immediately. Otherwise, your data will be deleted if pv magazine has processed your request or the purpose of data storage is fulfilled.
Further information on data privacy can be found in our Data Protection Policy.