Cornwall Insight Australia
In this Chart of the Week, we look at how price and curtailment differed over the two days and how rooftop solar and curtailment impacts may be managed in the National Electricity Market (NEM) moving forward.
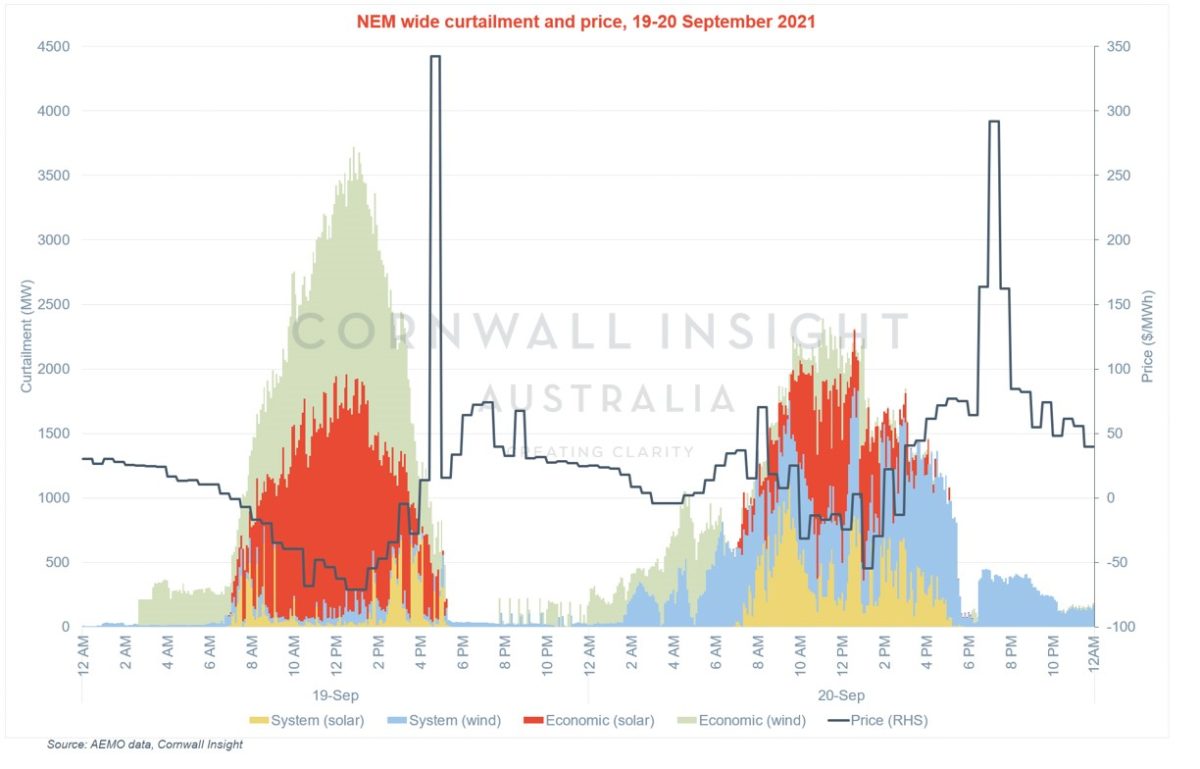
The chart shows the curtailed wind and solar for each five-minute interval alongside the half-hourly price over the two-day period. Curtailment has been categorised as economic, where a generator bids a unit out of dispatch to avoid low or negative prices, or system, where despite a generator’s bid being under the clearing price, Australian Energy Market Operator (AEMO) does not dispatch the unit to keep within constraints and maintain system security.
On Sunday, 19 September 2021, lower weekend demand and sunny but mild weather resulted in average NEM-wide negative prices throughout the day. At its peak, over 3.5 GW of wind and solar was curtailed (over 20% of the ~15 GW generating at the time), 89% of which was driven by economic curtailment, primarily from Queensland solar (24% of total curtailment) and South Australia and Victorian wind (23 and 21% of total).
Monday, 20 September 2021, saw similar weather but increased weekday demand, with higher prices following naturally. Daytime system curtailment increased as those that chose economic curtailment on Sunday priced themselves back in the market, with increased demand meaning less curtailment needed overall. Curtailment was 66% system-driven, dominated by South Australian wind (38% of total), followed by Queensland solar (11% of total); positively, this curtailment in South Australia will reduce in the coming months as 4 synchronous condensers are integrated and increase the allowable amount of VRE at a given time.
This difference in curtailment types over the two days was driven largely by the difference between weekday and weekend demand. As more rooftop solar is installed in Australia, operational demand will continue to decrease. Sunny weekdays are becoming more like weekends, resulting in more negative price intervals. As a result of rooftop solar seeing no price signal and therefore being dispatched irrespective of price, utility scale solar is seeing decreasing captured prices as it competes directly with these rooftop solar volumes. This is making the investment case increasingly difficult.
Whilst system curtailment will reduce as network upgrades allow for higher penetrations of renewable generation, solutions such as co-located battery storage will be required to capture value from energy otherwise lost due to curtailment. Due to costly and complex regulation and participation requirements, few facilities of this type exist to date in the NEM.
The Australian Energy Market Commission’s (AEMC) recent Integrating Storage into the NEM rule change draft determination aims to remove barriers to entry for hybrid generation and storage facilities, including provision for efficient DC-DC connected systems which to date have not been possible under the NER.
As storage costs reduce, co-location with grid-scale solar facilities could be key to remaining competitive with rooftop solar. Increased demand through electrification (e.g. EVs and heat pumps) and green hydrogen production can also mitigate this problem but is unlikely to be significant in the near to mid-term as adoption slowly increases.
Our Energy Market Perspective and Market Alert subscription products provide detailed analysis on the curtailment trends, network developments, and regulatory changes that can impact new and existing generation and storage projects.
The views and opinions expressed in this article are the author’s own, and do not necessarily reflect those held by pv magazine.
This content is protected by copyright and may not be reused. If you want to cooperate with us and would like to reuse some of our content, please contact: editors@pv-magazine.com.


17 comments
By submitting this form you agree to pv magazine using your data for the purposes of publishing your comment.
Your personal data will only be disclosed or otherwise transmitted to third parties for the purposes of spam filtering or if this is necessary for technical maintenance of the website. Any other transfer to third parties will not take place unless this is justified on the basis of applicable data protection regulations or if pv magazine is legally obliged to do so.
You may revoke this consent at any time with effect for the future, in which case your personal data will be deleted immediately. Otherwise, your data will be deleted if pv magazine has processed your request or the purpose of data storage is fulfilled.
Further information on data privacy can be found in our Data Protection Policy.