A new report released by the Australian Energy Market Operator (AEMO) reveals that renewable energy generation, including rooftop solar PV and grid-scale variable renewable generation (VRE) supplied more than 60% of the underlying demand in the National Electricity Market (NEM) during a half-hour period in September, helping deliver a dramatic decline in wholesale electricity prices.
In the latest Quarterly Energy Dynamics report, which covers the period 1 July to 30 September, AEMO says the penetration of renewables, including grid-scale wind and solar, hydro, battery discharge, and distributed PV reached a record high during a half-hour period on the afternoon of September 24, supplying 61.4% of total electricity generated in the NEM.
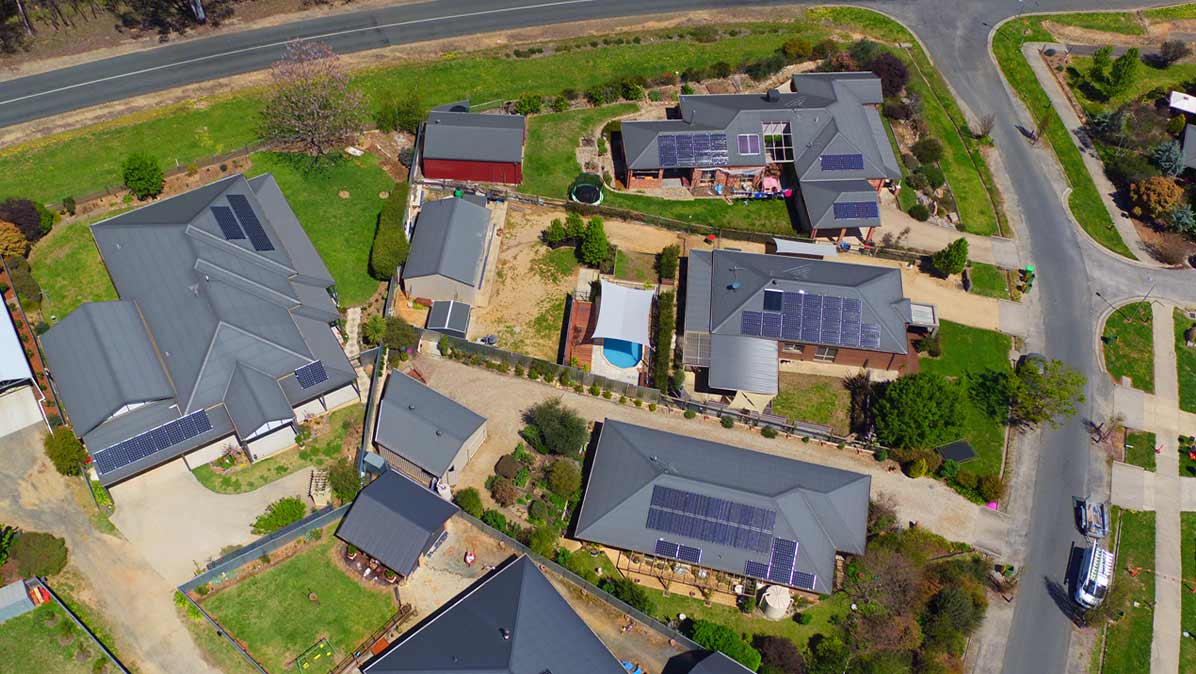
Rooftop solar dominated the mix, accounting for 31% of total generation, followed by wind and grid-scale solar at 28%.
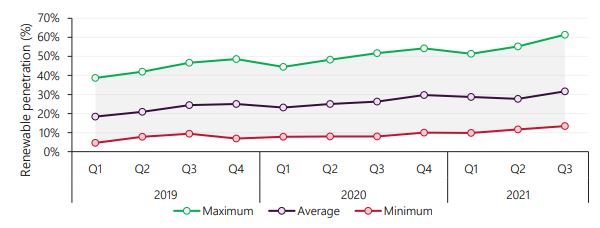
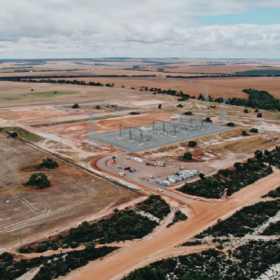
Image: AEMO
The previous renewable energy generation record of 55.2%, set in Q2 2021, was successively increased several times during the quarter while the average renewables share for the quarter reached 31.7% of total generation, surpassing the previous record (29.7%) set in Q4 2020.
AEMO said the continued uptake of distributed PV and growth in grid-scale VRE across the NEM had provided several other new highs for renewable output.
Grid-scale VRE generation averaged 3,984 MW for the quarter, an increase of 828 MW on the same time last year, the highest quarter-on-quarter increase on record.
Large-scale solar output also set a new output record, contributing 3,884 MW of underlying demand on 8 September, 462 MW higher than the previous record set in Q1 2021.
The situation was similar in Western Australia’s Wholesale Electricity Market (WEM) where renewables also reached new heights. Renewable generation supplied a record 70% of the underlying demand on September 7. Across the quarter, approximately 25% of underlying demand was met by renewable generation, an increase of more than 4% compared to Q3 last year.
AEMO said renewable output had been boosted by commissioning and ramping up of new wind and solar generation over the seasonally windy quarter, higher distributed PV (+341 MW on average) combined with higher rainfall driving increased hydro output from Tasmania.
AEMO chief markets officer Violette Mouchaileh said the increase in renewable energy supply, combined with a reduction in demand due to mild weather during August and Covid-19 restrictions, had put downward pressure on electricity prices in the NEM.
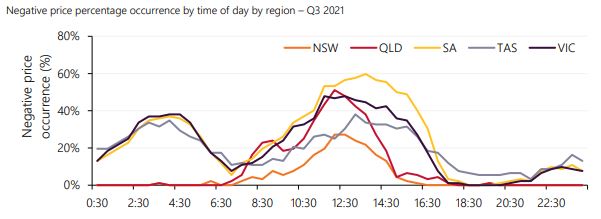
Negative spot price occurrence was mainly confined to middle of the day, with some overnight
increases in the southern states.Across the quarter, 16% of NEM trading intervals were zero or negative, more than double the previous record of 7% in Q4 2020.
Mainland NEM prices averaged $37/MWh during September, resulting in a quarterly average of $66/MWh, down from $95/MWh in the previous quarter but still above Q3 2020’s $42/MWh.
In Victoria, where households and businesses have only just exited an extended period of Covid-induced lockdown measures, average spot prices between 10am and 3.30pm fell from $30/MWh in Q3 2020 to just $0.01/MWh during August and September.
This comes after South Australia achieved average daytime prices below zero consistently between 10am and 3,30pm during the March 2021 quarter, the first time in the NEM’s history.
“The continued growth in distributed PV pushed minimum operational demand levels to record lows,” Mouchaileh said.
“In New South Wales (NSW), minimum demand from the grid fell to 4,872 MW, the lowest level since Q1 2000, while South Australia’s minimum demand record fell by 21% to 236 MW.”
The occurrence of negative spot prices was up across the entire NEM, with records set in all regions including NSW where negative prices have been rare (Figure 17).
AEMO said increased periods of low midday demand due to distributed PV coupled with high grid-scale solar output were key drivers of the record number of negative price intervals which increased substantially across all regions.
The largest increase was in the southern regions, with South Australian spot prices negative 25% of the time, followed by Victoria (21%) and Tasmania (19%). In Queensland and NSW, negative spot price occurrence was also up but at much lower levels of 10% and 5%, respectively.
“This trend of falling prices through the quarter was in sharp contrast to international energy prices for LNG and coal which continued to rise throughout the quarter reaching record levels,” Mouchaileh said.
This content is protected by copyright and may not be reused. If you want to cooperate with us and would like to reuse some of our content, please contact: editors@pv-magazine.com.


By submitting this form you agree to pv magazine using your data for the purposes of publishing your comment.
Your personal data will only be disclosed or otherwise transmitted to third parties for the purposes of spam filtering or if this is necessary for technical maintenance of the website. Any other transfer to third parties will not take place unless this is justified on the basis of applicable data protection regulations or if pv magazine is legally obliged to do so.
You may revoke this consent at any time with effect for the future, in which case your personal data will be deleted immediately. Otherwise, your data will be deleted if pv magazine has processed your request or the purpose of data storage is fulfilled.
Further information on data privacy can be found in our Data Protection Policy.