On Monday, Slovakian solar forecasting company Solargis published a decade of solar mapping analysis for Australia, North America and India.
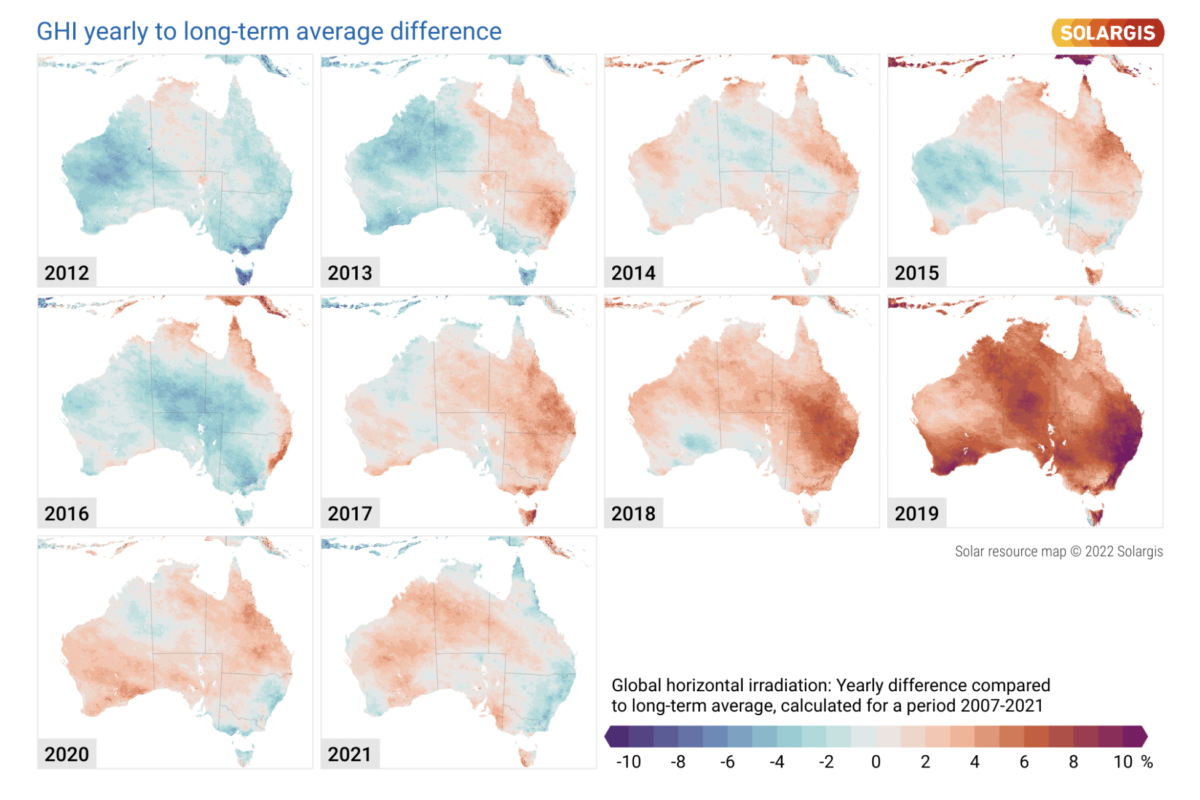
The maps show “significant resource variability,” Solargis said, which has increasing importance as margins for solar projects tighten.
In terms of Australia, where world-class solar irradiance has driven a massive boom in the uptake of PV technologies, Solargis’ analysis finds Australia’s consistency is wavering severely.
Compared with long-term averages, 2019 saw as much as a 10% increase in irradiance on the east coast. This extreme increase of course contributed to Australia’s worst ever bushfire season, known as Black Summer in 2020.
Likewise, Solgaris said its team is working to understand phenomena like the El Niño and La Niña weather patterns which have massively impacted rainfall and other aspects of Australia’s climate.
“The future of solar integration on the continent [Australia] depends on expert, reliable understanding of how investors and asset managers can prepare for and manage extreme weather events while integrating these future technologies into the grid as the nation transitions from fossil fuels,” the company’s statement read.
These changing solar conditions come on the back of an increasingly challenging financial landscape for solar. “We are seeing margins tighten on global solar projects, due to multiple factors like the phase out of tax credits and subsidies, price volatility and rising supply chain costs,” Solargis CEO Marcel Suri said.
This content is protected by copyright and may not be reused. If you want to cooperate with us and would like to reuse some of our content, please contact: editors@pv-magazine.com.


By submitting this form you agree to pv magazine using your data for the purposes of publishing your comment.
Your personal data will only be disclosed or otherwise transmitted to third parties for the purposes of spam filtering or if this is necessary for technical maintenance of the website. Any other transfer to third parties will not take place unless this is justified on the basis of applicable data protection regulations or if pv magazine is legally obliged to do so.
You may revoke this consent at any time with effect for the future, in which case your personal data will be deleted immediately. Otherwise, your data will be deleted if pv magazine has processed your request or the purpose of data storage is fulfilled.
Further information on data privacy can be found in our Data Protection Policy.