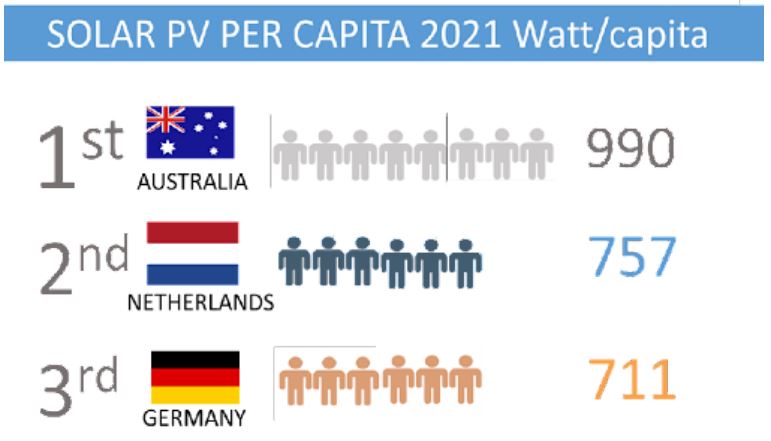
A new report published by the International Energy Agency (IEA) ranks Australia No.1 in the world for installed solar PV per capita with 990W per person, well ahead of European market leaders The Netherlands with 757W per person and Germany (711W) in third place.
The IEA’s Snapshot of Global PV Markets 2022 report, released on Monday, shows Australia also leads the way for solar PV penetration with 15.5%, edging out Spain (14.2%) and Greece (11.6%). The IEA said the trio of nations, along with Honduras, the Netherlands, Chile and Germany now have enough PV capacity to theoretically produce more than 10% of their annual electricity demand with solar.
Professor Renate Egan, from the University of New South Wales’ Digital Grid Futures Institute, said Australia continued to embrace both grid-scale and rooftop solar.
“Last year Australia moved ahead of Germany for the most solar installed per capita. With a strong year in 2021, we have increased our lead with solar now contributing over 13% of all electricity demand, a figure that has doubled in less than three years,” she said.
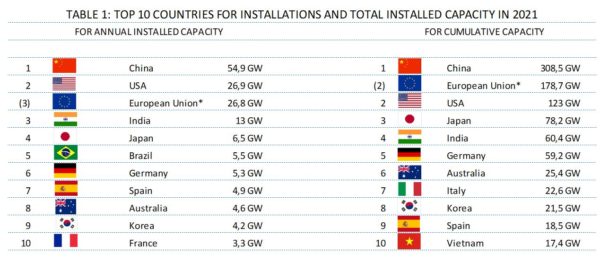
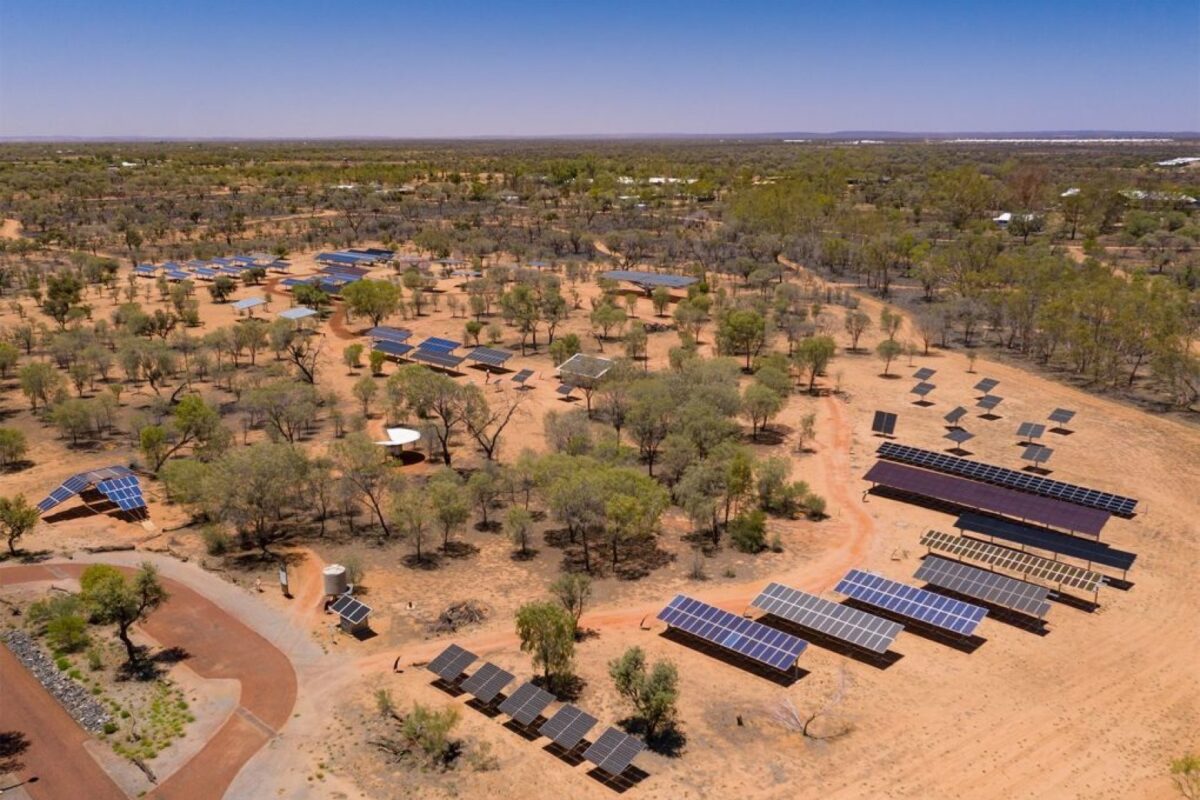
Australia also remains in the top 10 for both new installs and total market, as it has done for more than 20 years. The IEA said Australia installed 4.6GW of solar in 2021, taking the cumulative capacity to 25.4GW installed.
Egan, who contributed to the IEA report, said Australia had in 2021 installed more solar PV per day than it did in the whole of 1992.
“The APVI has been tracking solar PV installs in Australia since 1992, when 7MW was installed, with only 1.6MW on grid,” she said. “With at least 4.6GW installed in 2021, we are now installing twice as much every day as we did in an entire year in 1992.”
The report, which analyses the 2021 preliminary reported PV market data, found that despite a second year of pandemic-related disruptions, the global PV market grew significantly. More than 175GW of solar PV was installed and commissioned globally with China in the top spot for annual installed and total cumulative PV capacity.
China installed 54.9GW of solar in 2021, up from 48.2GW in 2020 and 30.1GW in 2019. China also remains the leader in terms of cumulative capacity with 308.5GW installed, almost one third of the global PV installed capacity.
The total cumulative installed capacity at the end of 2021 globally amounted to at least 942GW with the European Union (178.7GW), the United States (122.9 GW), Japan (78,2 GW) and India (60,4 GW) among the top five contributors.
This content is protected by copyright and may not be reused. If you want to cooperate with us and would like to reuse some of our content, please contact: editors@pv-magazine.com.



2 comments
By submitting this form you agree to pv magazine using your data for the purposes of publishing your comment.
Your personal data will only be disclosed or otherwise transmitted to third parties for the purposes of spam filtering or if this is necessary for technical maintenance of the website. Any other transfer to third parties will not take place unless this is justified on the basis of applicable data protection regulations or if pv magazine is legally obliged to do so.
You may revoke this consent at any time with effect for the future, in which case your personal data will be deleted immediately. Otherwise, your data will be deleted if pv magazine has processed your request or the purpose of data storage is fulfilled.
Further information on data privacy can be found in our Data Protection Policy.