The International Renewable Energy Agency (IRENA) has published a first-of-its-kind report on the cost of financing for renewable power, covering solar PV, onshore, and offshore wind technologies across all major global markets.
The agency obtained the data from 172 survey answers from 56 experts as well as 33 interviews. The responses provide the cost of capital (CoC) data from 45 countries for at least one of the three renewable technologies across six continents.
The cost of capital expresses the expected financial return, or the minimum required rate, for investing in a company or a project. It is calculated as the weighted average between the costs of debt and equity, where the cost of debt is the interest rate that a project secures from lenders, and the cost of equity is the financial return expected by shareholders in exchange for providing capital.
The cost of capital is a major determinant of the levelized cost of electricity (LCOE) for solar PV and other renewables. According to IRENA, the total cost of electricity for a representative PV project increases by 80% if the CoC is 10% rather than 2%.
“Even small differences in CoC that are not properly accounted for between countries and technologies can result in significant misrepresentations of renewable energy costs and lead to poor policy making,” IRENA says in the report. “Reliable data and an enhanced understanding of the composition of the CoC and its drivers are therefore critical to developing tailored support mechanisms and market designs that take different technology and country risks into account.”
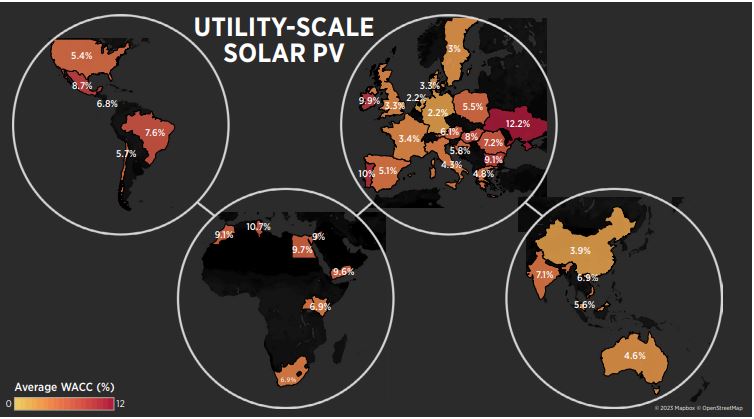
Results show that for all the locations surveyed the cost of capital for utility-scale PV is lowest in Germany and the Netherlands, both at 2.2%. In Europe, Sweden follows at 3%, with Denmark and the United Kingdom at 3.3%. The CoC in Spain, France, and Italy is 5.1%, 3.4%, and 4.3%, respectively. Ireland, Portugal, and Ukraine show the worst results, at 9.9%, 10%, and 12.2%, respectively.
China tops the Asia Pacific region with one of the best global results at 3.9%, with Australia following closely at 4.6%, and then Malaysia at 5.6%. Vietnam is at 6.9% while India has the worst result of the African countries surveyed at 7.1%.
In North America, the United States has a CoC of 5.4% and Mexico of 8.7%. Chile beats Brazil in South America, with 5.7% against Brazil’s 7.6%. The best results in Africa are from South Africa and Kenya at 6.9%, whereas Tunisia has a CoC of 10.7%.
The good results of China, North America, and Western Europe are underlined by a mature PV market, according to IRENA.
“In these locations, renewable energy financing is underwriting the deployment of renewable power generation capacity,” it said in the report.
The agency also noted that the share of debt in the CoC is low in both North America and Western Europe but for different reasons. In the United States, the debt share is typically low, between 35% and 65%, because “the tax credits used to accelerate solar and wind deployment incentivize the use of equity,” whose costs are nevertheless low due to tax credits, IRENA explained. On the other hand, debt share is typically larger in Europe, at 80% or more, but the cost of debt is very low due to low base rates from the banking sector.
This content is protected by copyright and may not be reused. If you want to cooperate with us and would like to reuse some of our content, please contact: editors@pv-magazine.com.


By submitting this form you agree to pv magazine using your data for the purposes of publishing your comment.
Your personal data will only be disclosed or otherwise transmitted to third parties for the purposes of spam filtering or if this is necessary for technical maintenance of the website. Any other transfer to third parties will not take place unless this is justified on the basis of applicable data protection regulations or if pv magazine is legally obliged to do so.
You may revoke this consent at any time with effect for the future, in which case your personal data will be deleted immediately. Otherwise, your data will be deleted if pv magazine has processed your request or the purpose of data storage is fulfilled.
Further information on data privacy can be found in our Data Protection Policy.