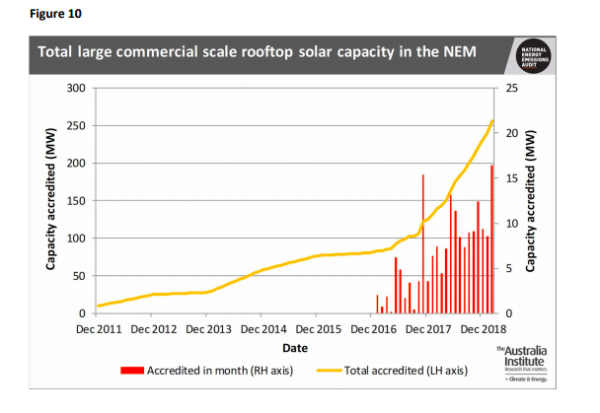
Medium to large rooftop solar systems are taking off, contributing with other solar and wind energy to the jump from 10% to 15% of the energy supplied to the grid over the last year, finds the latest National Energy Emissions Audit from The Australia Institute Climate & Energy Program.
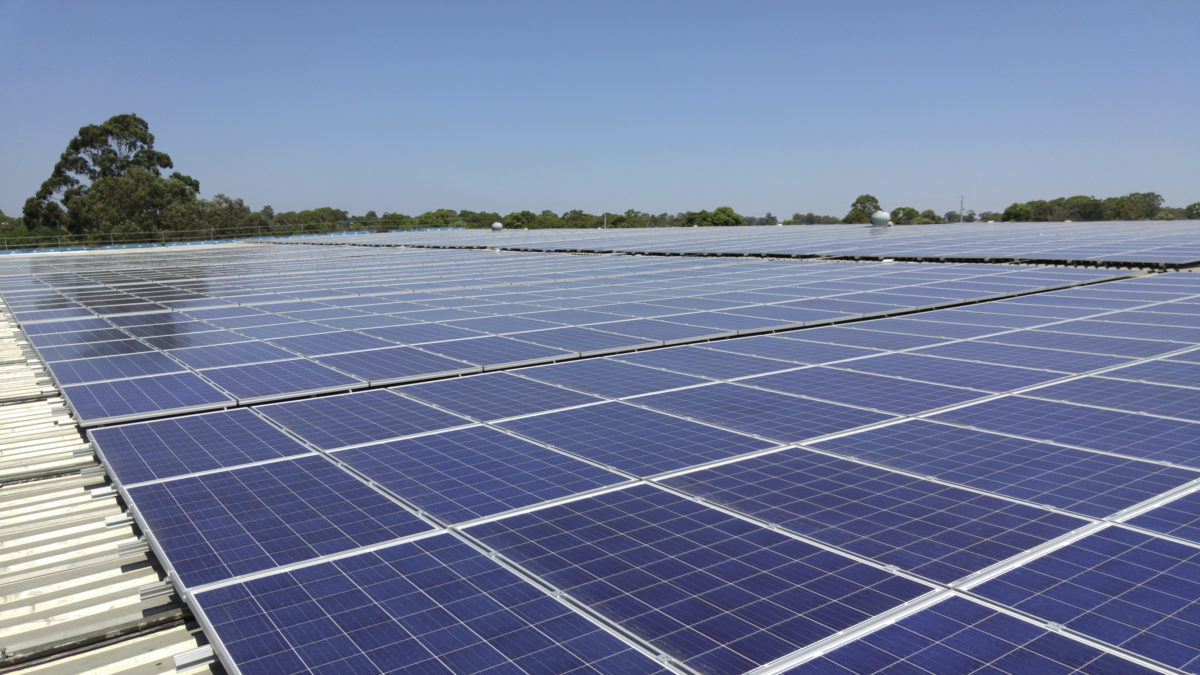
While residential rooftop PV still accounts for the lion’s share of installs, commercial PV – both smaller (between 15 and 100 kW capacity) and larger (more than 100 kW) – has made strong contribution for the first time ever, over the past nine months.
Indeed, Australia’s commercial and industrial (C&I) solar market segment is going from strength to strength, as power bills continue to hurt bottom lines of businesses Down Under. The trend has spurred the adoption of innovative solutions, such as Australian-made relocatable solar pods, which are trialling across 25 shopping centwers and NSW Government sites, or bifacial solar panels to squeeze greater yields from commercial rooftops, as those deployed by retail property group Vicinity Centers.
On the back of a 45% increase in commercial solar installations and 43% in the residential sector throughout 2018, rooftop solar experienced its best ever year in 2018, with 1.55 GW of new capacity added both in the commercial and residential market, the figures from the Clean Energy Council (CEC) previously showed. This has led to the cumulative total of more than 8.1 GW of solar PV installed on rooftops, as the average system size continued to increase and reached 7.13 kW.
“Rooftop solar capacity continues to accelerate and, while residential scale installations continue to dominate, commercial scale installations are for the first time ever making strong contributions,” says Hugh Saddler, author of the TAI report.
Emissions and demand
Continued fall in annual emissions over the past few months has been mainly driven by a large absolute increase in large scale solar generation, TAI finds. While the falling emissions in the electricity sector previously came from rapidly falling gas generation, utility-scale solar has stepped in as the total generating capacity of completed projects increased close to five times (480%), from 382 MW at the end of 2017 to 1824 MW in 2018. Annual gas generation was almost constant since December last, the report states.
During the summer 2018-19, peak 30 minute (trading interval) demand reached record levels in both Queensland and South Australia. The records occurred even with significant contributions of rooftop solar that shaved daily peaks amid scorching temperatures.
Another key finding in the latest TAI report was that total grid supplied electrical energy consumed in South Australia over the four summer months (December to March) was amongst the lowest experienced over the past 15 years. This means that the average utilisation of grid supply assets in the state, or so-called “baseload” consumption, is continuing to decrease from already low levels.
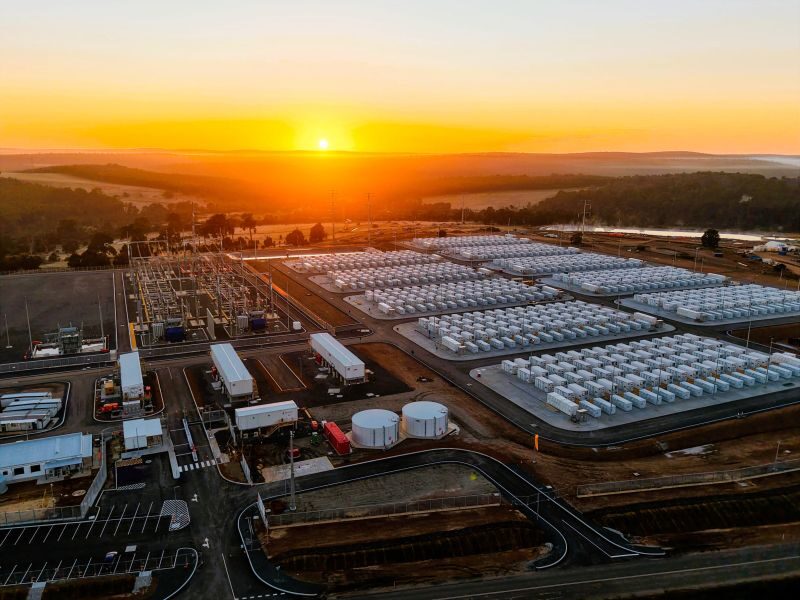
“Nothing could more clearly demonstrate how out of touch with reality are calls for new “base load” generation, while also showing, by contrast, the increasing potential value of energy storage, whether supplied by batteries or pumped hydro,” the report states.
This content is protected by copyright and may not be reused. If you want to cooperate with us and would like to reuse some of our content, please contact: editors@pv-magazine.com.


1 comment
By submitting this form you agree to pv magazine using your data for the purposes of publishing your comment.
Your personal data will only be disclosed or otherwise transmitted to third parties for the purposes of spam filtering or if this is necessary for technical maintenance of the website. Any other transfer to third parties will not take place unless this is justified on the basis of applicable data protection regulations or if pv magazine is legally obliged to do so.
You may revoke this consent at any time with effect for the future, in which case your personal data will be deleted immediately. Otherwise, your data will be deleted if pv magazine has processed your request or the purpose of data storage is fulfilled.
Further information on data privacy can be found in our Data Protection Policy.