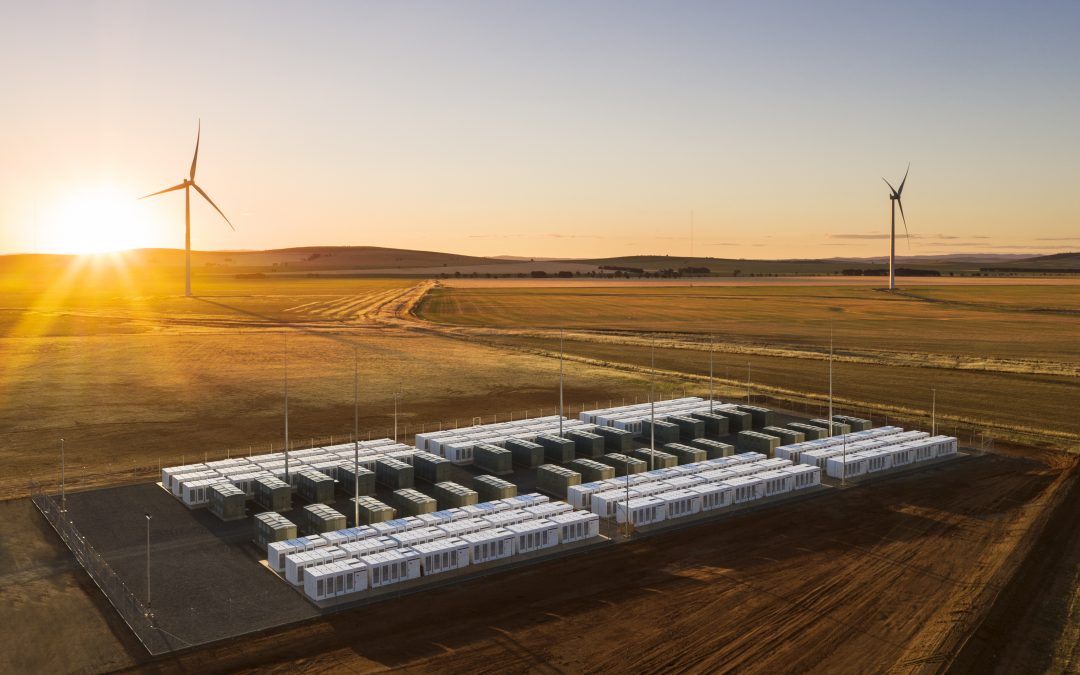
Although South Australia still retains the trophy for the highest volumes of renewable generation — both at grid level, and when rooftop solar is included — New South Wales and Victoria are battling it out to topple South Australia from the podium, according to The Australia Institute’s July National Energy Emissions Audit.
Over the past 14 months annual output from grid-scale wind and solar in New South Wales has doubled, and Victoria is not far behind, which places both states as contenders to overtake South Australia as the highest renewables generator with just over 7,000 GWh on the grid.
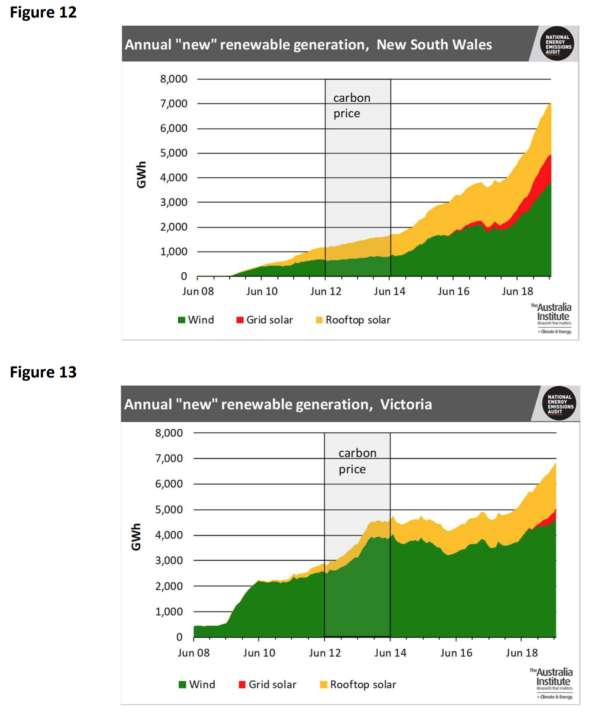
Graphs: The Australia Institute
In terms of overall renewable generation, Queensland is out of the comp … except on the solar front where it trounces all others in terms of grid and rooftop generation, and jobs in the solar industry.
South Australia still the state to emulate
Report author Hugh Saddler points out that the renewables’ share of total generation is far higher in South Australia than in NSW, Victoria or Queensland, because total generation is lower: “It is of course the high share of renewable generation rather than the absolute quantity, which places South Australia on the cutting edge of incorporating variable renewable generation into existing electricity grids,” he writes.
In fact, total grid solar and wind generation in South Australia exceeded the state’s demand for electricity during some 1,080 30-minute trading intervals (or 6.2%) over the year. This number would have been higher if AEMO had not at various times required South Australia to curtail output from some of its wind generators, to maintain stability of supply in the NEM as a whole.
Who or what type of generation gets the guernsey all depends on how you slice the cake, and Saddler always slices it for revealing insights.
Utility-scale solar hits its stride with PPA support
For example, he says that although growth in wind and rooftop solar has been relatively steady for some years, “nearly all the growth in grid-connected solar generation has occurred since the beginning of 2018”.
And a substantial slice of new grid-connected solar, along with a sliver of wind, has been financed by power purchase agreements, contracted by large commercial and industrial consumers as they seek to hedge against their growing power bills.
Electricity system emissions down but not out
The audit’s reason for being as reflected in its title reveals that the NEM has seen continued reductions in both average emissions intensity and in total emissions from NEM generation, but not only because of increased renewable penetration: the year saw, for example, a significant decrease in brown coal generation in Victoria, mostly due to reduction in output from the Loy Yang A coal-fired power station, where Unit 2 has been out of action since mid May and is not expected to come back online until December.
Australia’s main hydro generators, in the Snowy Mountains and in Tasmania have also dropped off in their contributions of clean energy to the grid over the past six months due to low rainfall throughout eastern Australia.
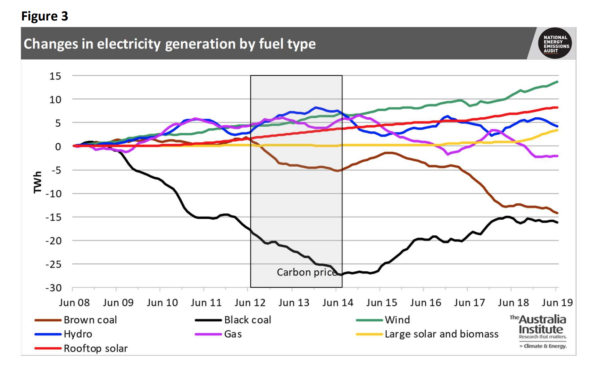
Graph: The Australia Institute
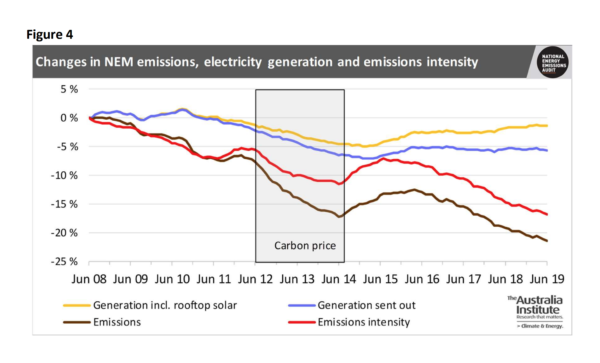
Screen shot from the July National Energy Emissions Audit, uploaded by Natalie Filatoff on 29/7/19
The historical perspective on generation and transmission
In a quirky twist, The Australia Institute also shines a light through the coal dust that brought Australia electricity on a scale never before imagined, by comparing the changes that occurred in Australia’s electricity system between the years 1953 and 1961, with the renewable transition to date — during the nine years from 2011 to 2019.
Saddler reminds us that in the early 1950s, “Electricity supply was a relative luxury, available almost exclusively to businesses and households located in state capital cities and a few larger regional centres.” But by 1961, the proliferation of electronic goods coincided with a power surge provided by six state electricity commissions having built the statewide generation and transmission systems still in place.
Over the nine-year period of renewables growth, says Saddler new wind and solar has been “only a small fraction of total capacity in place”, until the past two years of incremental boom; whereas the 1950s saw system capacity increase by between 8% and 16% per annum.
He concludes that the earlier transition in Australia’s electricity supply system “was larger and no less transformative than the transition which is happening today”.
This content is protected by copyright and may not be reused. If you want to cooperate with us and would like to reuse some of our content, please contact: editors@pv-magazine.com.


I think every country and state in the world should take a leaf out of South Australia’s book. The front-runner of renewable energy is an exemplar. Through wind and solar power, we really can power every household in the world. Kudos to NSW and Victoria for following the lead.
Renewable energies like Solar energy is the solution to our future energy requirements.