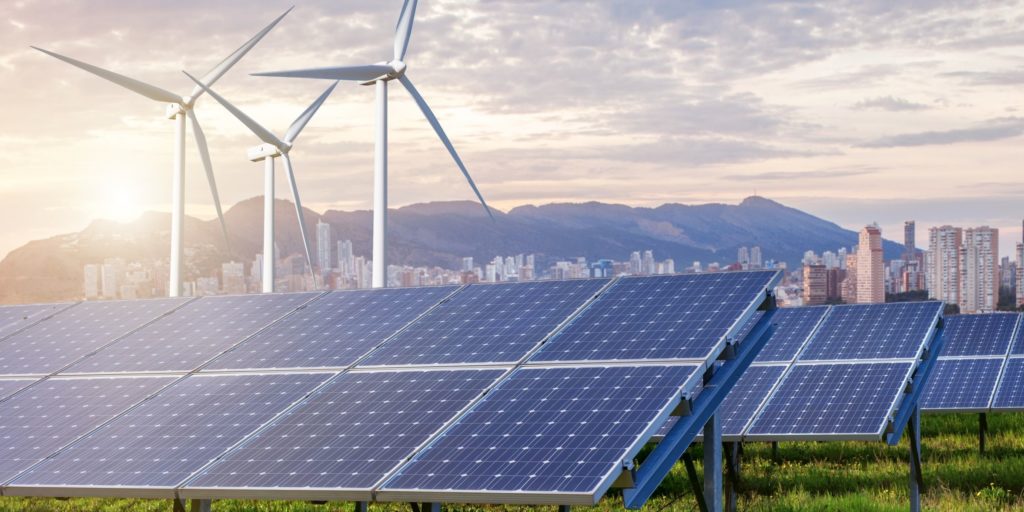
Coal and gas are beginning to look as dark and forgotten as winter now that spring has come. The seasonal change has brought ideal weather conditions for wind and solar across the National Electricity Market (NEM), resulting in record highs of renewable integration, and once again demonstrating that gas and coal look about as auspicious of a rapid recovery as an Amish ambulance, and just as anachronistic.
According to the Australian Energy Market Operator (AEMO), wind and solar contributed 11.7 GW (46.5%) of total energy at the settlement period around midday on the 20th of August. A mark surpassing the previous record set in November 2019 by some 400 MW.
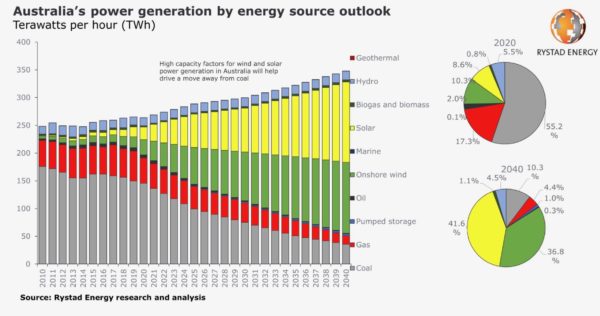
Despite Federal Government obstinacy, records of clean energy integration are falling with the ease of Neymar in the penalty box. Indeed, Rystad Energy analysis has shown that the combined power production of coal and gas will be overtaken by solar and onshore wind generation by 2026.
In fact, Rystad Energy’s analysis has renewable power generation capacity for solar and wind topping coal and gas from 2023, but grid congestion is preventing new clean energy from reaching our population centres.
Of course, the real threat to the energy transition in Australia is no longer coal but gas. The Federal Government is keen to promote a gas-led economic recovery from the Covid-19 crisis, but Rystad Energy expects the levels of gas-fired power generation to fall indefinitely.
Gas peaked in 2017 at 55.33 TWh after a decade on the rise. But as analysis from Cornwall Insight Australia Lead Consultant Lumi Adisa demonstrates, looking New South Wales (NSW) in particular, Q2 2017 saw gas and hydro’s total share of merchant revenues (excluding coal) reach 76%, while wind and solar shared a total of 24%. Three years later, in Q2 2020, and those figures have almost reversed, with gas and hydro sharing 40% of non-coal merchant revenues whilst wind and solar have soared to a 60% share.
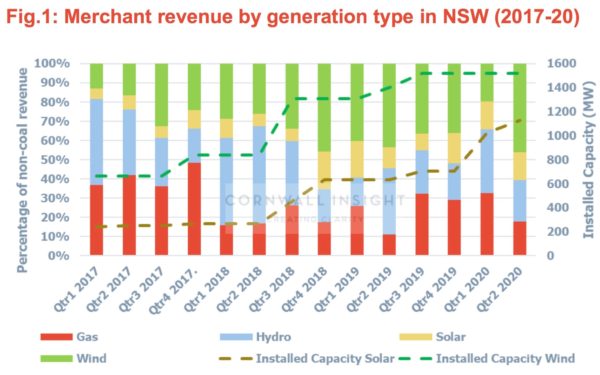
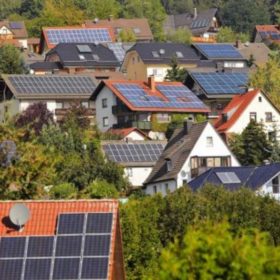
In the last three years, wind has more than doubled its capacity in NSW while gas’ revenue share has dropped from 42% to 18%. Over that same period solar has also increased its revenue share in NSW from 7% to 14% thanks to a four-fold increase in capacity. What we are seeing then is wind and solar pushing out gas, with wind outperforming solar on revenues but with solar growing.
“Our analysis show that wind is achieving more than four times the increase in revenue of solar for each MW increase in capacity,” says Adisa, who identifies the cause of this trend in the time-of-day price shape in the NEM favouring wind.
“Given the higher run costs of gas units,” continues Adisa, “they have always been expected to run during peak periods (early evenings just after sunset). However, with many planned wind projects and (potentially) REZs in the state, it is left to be seen how far wind (and storage) can push gas out of the merchant market.
Moreover, with Rystad estimating an almost ten-fold increase in pumped storage by 2040, the long duration dips in wind and solar should not pose too much of a problem to the NEM, with increasing lithium-ion battery integration to cover the short-duration shifts.
And so it seems that whilst an understanding of basic economics shows us that the market does not have a mind, the Federal Government is revealing itself as being worse than mindless.
Spring cleaning our way to an invincible summer
Through 2026, Rystad Energy expects solar and onshore wind generation to grow between 10 and 15 TWh to reach a cumulative electricity output exceeding coal and gas at just above 134 TWh.
However, Rystad’s analysis once again reveals the hindrance of transmission limitations delaying renewable energy transition. According to Rystad Energy’s senior analyst David Dixon, “The challenge will be to successfully shift from a centralised grid to one that is inverter/weather-based. Also, the lack of new transmission capacity is likely to be an obstacle. Most areas rich and solar and wind resources in Australia are located inland and far away from urban centres and cities. Currently, the transmission system is fixed from coal generators to the cities and is weak at areas inland.”
New analysis from the Australian National University (ANU) concurs with Dixon, leading Professor Professor Andrew Blakers to insist that “we urgently need more investment to remove bottlenecks in deployment of further renewables.”
“An effective way to do this is to upgrade transmission lines from rural Renewable Energy Zones, such as those recently announced in NSW and Queensland, to our cities,” said Blakers. “While our governments have been slow to act on transmission, if the Federal and state governments make determined efforts to rapidly resolve these bottlenecks, we can get ahead of the solar and wind construction curve instead of lagging behind it.”
The ANU study’s authors noted that AEMO’s 2020 Integrated System Plan (ISP) is the right pathway to the changes and upgrades Australia’s electricity system needs. Blakers and his colleagues argue that the ISP’s ambitious “Step Change” scenario, which posits an Australia in the late 2030s with 90% renewable energy, is remarkably achievable. In fact, the ANU analysis suggests Australia’s installation rates are already on the “Step Change” pathway: “It would therefore be prudent to model much more ambitious scenarios.”
Currently, $5.1 billion of capex is committed for transmission-related projects through 2025, 88% of which are in NSW, including the SA-NSW Interconnector. Rystad estimates that many of these projects will see completion by 2025.
The winds of change are upon us, however as coal and gas retire they may still do a lot of travelling abroad in the export market. Nevertheless, Australia’s spring cleaning is well on its way.
This content is protected by copyright and may not be reused. If you want to cooperate with us and would like to reuse some of our content, please contact: editors@pv-magazine.com.


1 comment
By submitting this form you agree to pv magazine using your data for the purposes of publishing your comment.
Your personal data will only be disclosed or otherwise transmitted to third parties for the purposes of spam filtering or if this is necessary for technical maintenance of the website. Any other transfer to third parties will not take place unless this is justified on the basis of applicable data protection regulations or if pv magazine is legally obliged to do so.
You may revoke this consent at any time with effect for the future, in which case your personal data will be deleted immediately. Otherwise, your data will be deleted if pv magazine has processed your request or the purpose of data storage is fulfilled.
Further information on data privacy can be found in our Data Protection Policy.