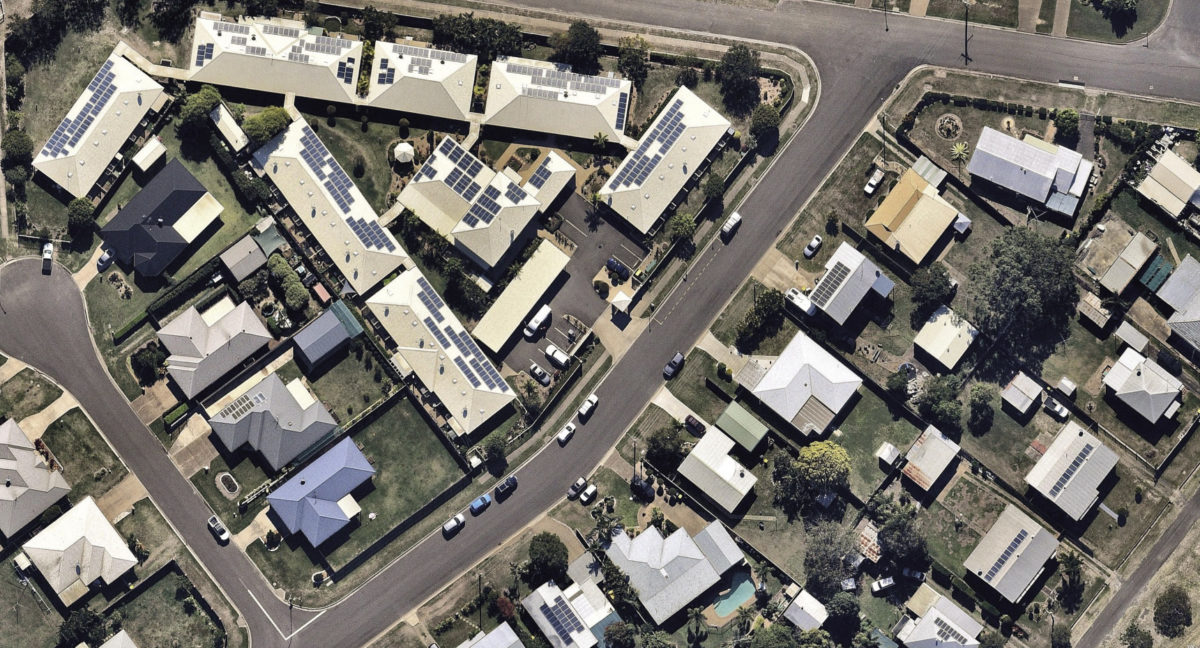
This year Australian rooftop solar installs have defied the doom and gloom of a severe pandemic-induced recession. Year to date up to August, around 1.86 GW of sub-100 kW solar had been registered, which is 40% up on capacity installs from January to August of last year. Given that solar installations tend to ramp upwards toward the end of the year, it might even be possible that they break through 3 GW by the end of the fourth quarter.
Potential limitations
However, there are reasons to be wary that this growth will continue. There are several clouds on the horizon that will likely curtail rooftop solar’s ongoing growth, and they have already arrested the boom in large-scale solar farm activity. Firstly, there is now so much solar capacity in Queensland, South Australia (SA), and also Western Australia (WA) that wholesale electricity market prices tend to be depressed to their lowest point in the middle of the day, not the usual time of 2 a.m. to 4 a.m. Victoria and NSW will soon follow the same pattern. Solar capacity is now such a large proportion of supply that it pushes out all the expensive generators. By around midday it then leaves coal plants desperately competing against one another to stay online, so they can remain available for a later surge in demand and prices in the evening, once solar retreats.
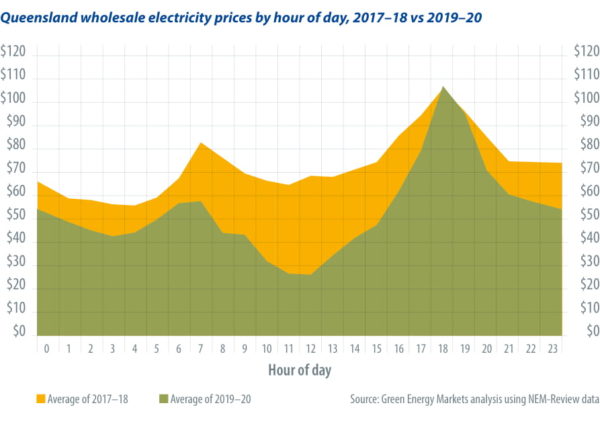
This solar-induced depression in wholesale power prices can be clearly seen in the chart on the bottom left comparing Queensland wholesale prices over 2017-18, before a surge in solar farm capacity. It also shows the 2019-20 period, after much of that solar capacity (as well as significant amounts of rooftop solar) went online.
It can be expected that low daytime wholesale power prices should ultimately flow through to feed-in tariffs (FITs) offered to solar system owners. In the state of WA this happened with an abrupt bang when the state government cut the FIT (up until 3 p.m.) to AUD 0.03 ($0.02)/kWh – down from AUD 0.071. A fall in FITs matters a lot because the typical household system exports roughly around 80% of its generation. Over the period since 2017, when rooftop solar began its second boom, FITs across the eastern states have been around AUD 0.10 or higher and noticeably higher in SA. With such prices the feed-in tariff revenue has equaled around half of the financial benefit to a householder. A FIT of AUD 0.03 would mean roughly a one-third reduction in the financial benefit a householder gains from a typical 6.6 kW system.
Solar sponge
The second headwind facing the solar sector is that network companies are moving toward tariff structures that will substantially reduce their charges during daylight hours, while significantly increasing them in the late afternoon or evening. SA Power Networks is leading the charge on these types of tariffs with what it refers to as a solar sponge tariff.

The third headwind confronting the sector is that network limits on inverter export capacity at 5 kWp inhibit the ability for the solar industry to continue to upsize households to larger solar systems. One of the pivotal aspects of solar’s growth and improving economics is the steady upsizing of households to larger and larger capacity systems. The chart on the right illustrates the increase in Australian rooftop system sizes.
The trend to larger systems has continued on into 2019 and 2020, such that the average residential system has reached about 6.6 kW. The number is no accident – it represents the exact number of panels that an installer can add to a 5 kW inverter while remaining eligible for the STC government rebate.
What this means is that the solar PV industry is heavily constrained from continuing to upsize households to larger systems. A comparison between 2011 and 2019 helps illustrate just how important this upsizing process has been to the growth of solar PV capacity. The amount of residential solar capacity installed in 2019 was around 1.75 GW (including upgrades) which is about twice as much capacity as was installed in 2011. But the number of systems installed was 25% less than 2011. So, the number of customer sales are actually lower, and the growth in capacity was entirely a function of upsizing to much larger system sizes.
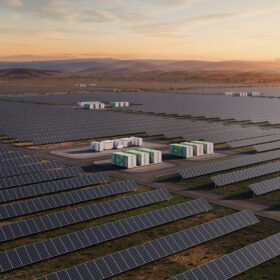
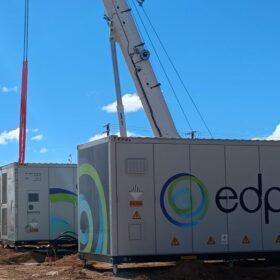
In order to counter these three headwinds, the solar industry needs batteries and energy management solutions to become more affordable and better packaged and integrated. Batteries stand out as an easy quick fix. The battery will soak up the generation that would otherwise be exported and then allow it to displace grid imports in the evening, when network companies and therefore also retailers will hike up prices. Unfortunately, batteries remain too expensive, so a lot is riding on foreshadowed cost reductions to materialize.

Author: Tristan Edis
Tristan Edis is the director of analysis and advisory for Green Energy Markets. The consulting firm provides market data and analysis to organizations that are heavily engaged in rooftop solar, large-scale power generation, demand management, and carbon abatement solutions.
The views and opinions expressed in this article are the author’s own, and do not necessarily reflect those held by pv magazine.
This content is protected by copyright and may not be reused. If you want to cooperate with us and would like to reuse some of our content, please contact: editors@pv-magazine.com.

By submitting this form you agree to pv magazine using your data for the purposes of publishing your comment.
Your personal data will only be disclosed or otherwise transmitted to third parties for the purposes of spam filtering or if this is necessary for technical maintenance of the website. Any other transfer to third parties will not take place unless this is justified on the basis of applicable data protection regulations or if pv magazine is legally obliged to do so.
You may revoke this consent at any time with effect for the future, in which case your personal data will be deleted immediately. Otherwise, your data will be deleted if pv magazine has processed your request or the purpose of data storage is fulfilled.
Further information on data privacy can be found in our Data Protection Policy.