From Watt Clarity,
The Quick Summary
- An equipment failure in the Torrens Island high voltage switchyard just after 5:30 PM local time (17:00 NEM time) – described in some reports as a “fire” – forced off about 670 MW of generation capacity at AGL’s Barker Inlet and Torrens Island B stations.
- About 870 MW of slow-start gas-fired generation capacity was not running and unavailable to replace this lost supply capacity – except for Pelican Point’s second gas turbine which came on some hours after the initial incident.
- Another 330 MW of capacity at fast-start gas and diesel-fuelled plants was unavailable for various reasons.
- Supply from Victoria was down by at least 150-200 MW because of transmission works on the Heywood interconnection, ironically the final stages of reinstating the permanent lines in Victoria knocked down by a severe storm in January 2020.
- Calm weather and the setting sun reduced output from renewables to virtually zero.
- All of the above left the region with a perilously thin margin of supply relative to demand, which peaked at about 1,800 MW.
- Not surprisingly, spot prices rocketed in the face of these very tight supply margins, reaching 5-digit values for various intervals between 18:00 and midnight (NEM time).
It would be easy to start apportioning “blame” for this near-miss event to a whole raft of factors – the shouting match over the recent unmitigated disaster in Texas provides a sorry template for that – but I think it’s more useful to start by looking at themes that might emerge from events like this one.
I’ll then examine a few micro-details of what must have been a white-knuckle ride for AEMO, AGL, and South Australian transmission operator ElectraNet, evident in the detailed market data.
The Bigger Picture
While there’s a lot of understandable interest in the granular detail of Friday evening’s events, too much focus on that risks missing some larger themes brought home by this and other notable events that have affected the NEM (mostly South Australia) in the last five years:
- September 2016 Black System
- February 2017 load shedding
- March 2017 (very) near miss
- January 2020 Snowy region bushfires
- January-February 2020 extended SA islanding
And that’s not an exhaustive list.
I’ve picked out three themes for discussion here.
Theme 1 – Expect the Unexpected (Reliability isn’t Resilience)
Power system reliability draws a lot of focus, hundreds of pages of dense reports, and terabytes of modelling data, but is fundamentally a pretty narrowly defined statistical process for quantifying the chances of having enough supply to continuously meet demand, and the extent of any deficits. It’s all based on modelling of “mathematically expected” probabilities of failure etc.
Power system resilience is a much more loosely framed topic dealing with the ability of a system to manage through unexpected disruptions and shocks. So far it hasn’t garnered nearly as many pages or terabytes, but I suspect it’s more likely to keep system operators awake at night.
A feature of all but one of the events listed above is that parts of the power system were hit by multiple contingencies that took out significantly more supply capability in one hit than registers in any traditional reliability (or system security) analysis – or if it does register, only at such low probability levels that it’s essentially ignored in the formal reliability metrics like “expected unserved energy” or “loss of load probability”.
Another feature of some events was the extended nature of the triggering contingency and ensuing disruptions.
Texas provides an even starker illustration of the difference between reliability and resilience, if one was needed.
The kinds of event relevant to a resilience analysis are – almost by definition – those that fall beyond the statistical reach of reliability modelling, but as these real world examples show they seem to happen often enough. It’s just that we don’t yet seem to have good ways of characterizing and planning for them, in a generalized sense.
It’s more than high time we developed some! Paul has made a similar specific suggestion in regard to AEMO’s next ESOO.
Theme 2 – Energy is not Capacity (megawatts ain’t megawatts)
This one is more specific, but has become a personal bugbear of mine.
Low output from renewables in South Australia last Friday evening was not a direct cause of the supply “crisis”. We should henceforth cancel any discussion and comparison of the capability or “performance” of fundamentally different supply sources that simply uses megawatts as a measuring stick.
OK that’s a bit extreme, but frankly, talking about “poor performance” or “unreliability” of variable renewable energy (VRE) sources like solar and wind generation in some system event, using short term megawatt output relative to nominal megawatt capacity (aka short term capacity factor), almost completely misses the point.
Equally missing the point is to discuss “replacement” of the retiring 1,400 MW Yallourn Power Station in Victoria with X thousand megawatts of VRE generation, whatever the value of X.
The point is that VRE generation is variable and we’ve known that forever. So we shouldn’t pretend for an instant that it’s surprising or unacceptable that VRE produces very little output when the sun isn’t shining and the wind isn’t blowing. Nor should we pretend that any number of VRE megawatts is somehow a like for like substitute for dispatchable capacity.
Regarding VRE “performance”, pointing the finger at South Australia’s renewables for producing at only (say) 2% of nominal capacity late on a calm evening makes about as much sense as castigating householders for all turning on their air conditioners when the temperature reaches 40 degrees. It’s an entirely expected outcome in both cases; of course balancing supply and demand would be easier if things were different, but atmospheric physics and human behaviour being what they are, these are just phenomena that need to be planned for and accommodated.
More than a few commentators, on discovering that VRE generation is – shock, horror – variable, next leap to a conclusion that it must be completely useless. These commentators evidently don’t get the distinction between capacity (megawatts) and energy (megawatt hours), nor do they understand generation economics.
Traditional dispatchable generation sources deliver both capacity and energy, at a cost, with a relatively predictable (“firm”) profile; VRE sources essentially deliver energy, at an increasingly lower cost, but with a stochastic capacity profile that has to be “managed around” – just like variable demand with all those annoying consumers turning on air conditioners also has to be “managed around”. Providing dispatchable capacity to complement the stochastic profiles of VRE and demand is one of the costs of this “managing around”. So are any measures increasingly required to deal with potentially excessive VRE output and low demand.
If the cost of VRE is low enough that after adding these “managing around” costs it’s still the cheapest source of system energy, then build more of it (when needed).
If the total of the VRE energy costs and the “managing around” costs becomes excessive, that’s the time to think about changing strategy.
Most of the time, the popular discussion of all this never gets to the economics – despite, for example, the earnest efforts of AEMO in its ISP – and instead gets hung up on arguments that “my megawatts are better / greener / cleaner / firmer than yours”.
We could even extend this discussion to comparisons between “dispatchable” megawatts at offline slow-start plant – clearly not of any use in a sudden supply shortfall like last Friday – versus dispatchable megawatts at batteries – good in short bursts – versus dispatchable megawatts at fast-start hydro or thermal plant. They’re all different, depending on circumstances.
{/rant}
Theme 3 – Transmission has its Limits
Another characteristic shared by most of the events I listed earlier is that transmission limitations and / or exposure of the transmission system to environmental risks played a very significant role.
This is really one specific domain of the wider reliability vs resilience space, but it’s very important in the NEM because relative to the electrical size of the system, it’s a very long and stringy transmission grid with relatively low redundancy compared to the more typical strongly meshed grids in densely populated regions of the world.
And although transmission equipment is inherently pretty reliable, it’s unavoidably exposed to the elements, and also requires regular maintenance that can further reduce redundancy and cause significant, albeit temporary, capacity reductions. Just like we saw last Friday.
Building more of it to more tightly integrate the NEM should on the face of things improve reliability and resilience, but careful attention will need to be given to avoiding unintended consequences – a region which becomes more reliant on energy flows across lengthy interconnections which remain exposed to multiple failure modes and risk factors may not end up with much higher resilience.
I haven’t seen firm evidence one way or the other (and any assessment would need a hypothetical counterfactual), but I do wonder how much resilience – as opposed to lower average energy costs – South Australia has gained with the significant upgrade in capacity on the interconnection via Heywood in recent years. The flip side of this increased capacity may have been larger disruptions in that capacity when failures or maintenance occur (perhaps in conjunction with other events, such as last Friday’s), with at least the possibility of poorer overall resilience outcomes.
Three micro-details
As Paul has already produced a very detailed timeline of events, and I’m time-limited for this analysis, I’ll just pick out three details relying on some further market data mostly not available at the time of his write-up.
Microdetail 1 – TIPS B Rebidding
Without going into the schematics of the Torrens Island switchyard, my understanding is that the failure that forced off AGL’s Barker Inlet plant took out one of the two high voltage buses that also connect Torrens Island B, leaving its three units online at the time (B2, B3 and B4) more exposed to a consequential risk of tripping. Also in the aftermath of the incident, it was apparently unclear that these units would be able to remain online while damage to the switchyard was being assessed.
This led to a constraint on TIPS B that initially limited output to 270 MW (out of 800 MW registered capacity), and then from DI 19:20 (two hours after the initial incident) additional constraints and rebids that should prima facie have taken TIPS B3 and B4 offline, leaving just 60 MW running at TIPS B2. However for reasons that are not clear, TIPS B3 and B4 remained online each at a minimum load of 40 MW for a period of over an hour despite market dispatch targets to go offline. This is all summarized in the chart below:

A possible reason for TIPS B3 and B4 not following dispatch targets, and their owner’s own declared zero availability, from around DI 19:30 is that at this point there was virtually no spare dispatchable capacity remaining in South Australia, interconnector flows were at limit (reduced by the transmission work in Victoria), and removing another 80 MW of supply might have been the “straw that broke the camel’s back” and led to forced load shedding. This is speculation, but I have no doubt there were intense discussions at this time between AEMO, ElectraNet and AGL, and it’s just possible that AGL was asked to hold off tripping its two B units while the situation was assessed, and while a second gas turbine at Engie’s Pelican Point power station was in the process of starting up.
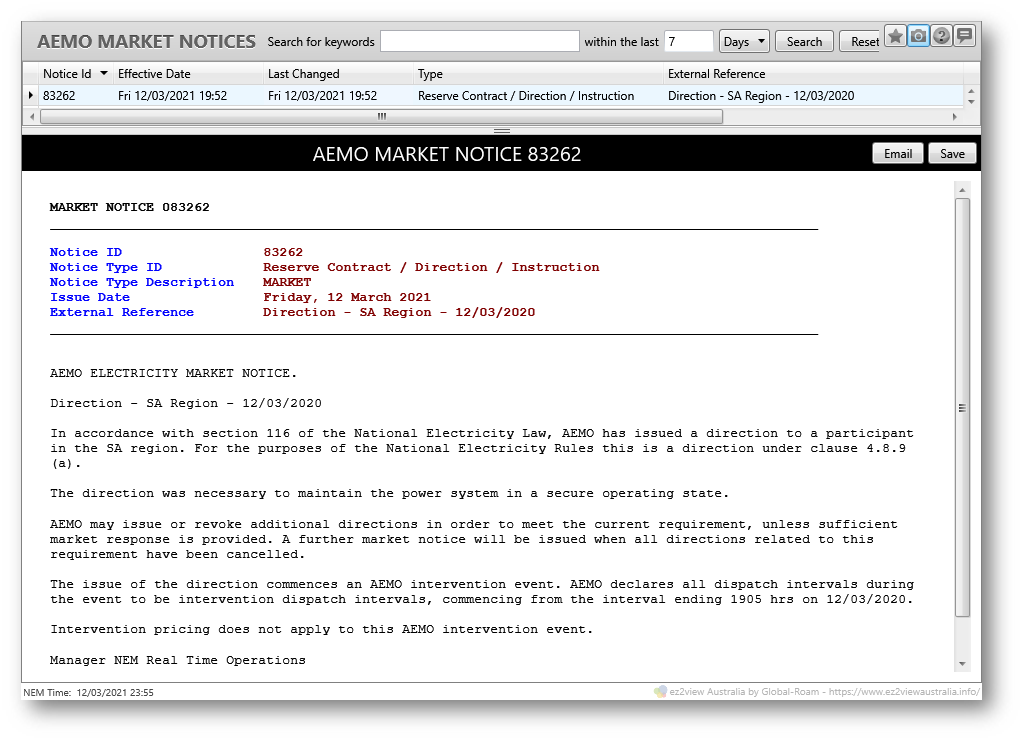
Microdetail 2 – Pelican Point Direction
Whilst the above situation was evolving at Torrens Island B, the overall supply position began easing from DI 20:05 when Pelican Point synchronised its second gas turbine – whose capacity had been bid unavailable for some days prior to the event.
Rebid volumes and reasons for Pelican Point appear to indicate that this second unit was only started in response to a direction from AEMO, issued some time before 19:05 NEM time (actual time of issue is not visible in public market data, we just have to infer from things like rebid reasons and times). Presumably this is the direction referred to in a slightly later public market notice from AEMO:
The impact of the direction on Pelican Point’s offered capacity is summarised in the following panel of four rebids received by AEMO between 18:46 and 20:17 NEM time:
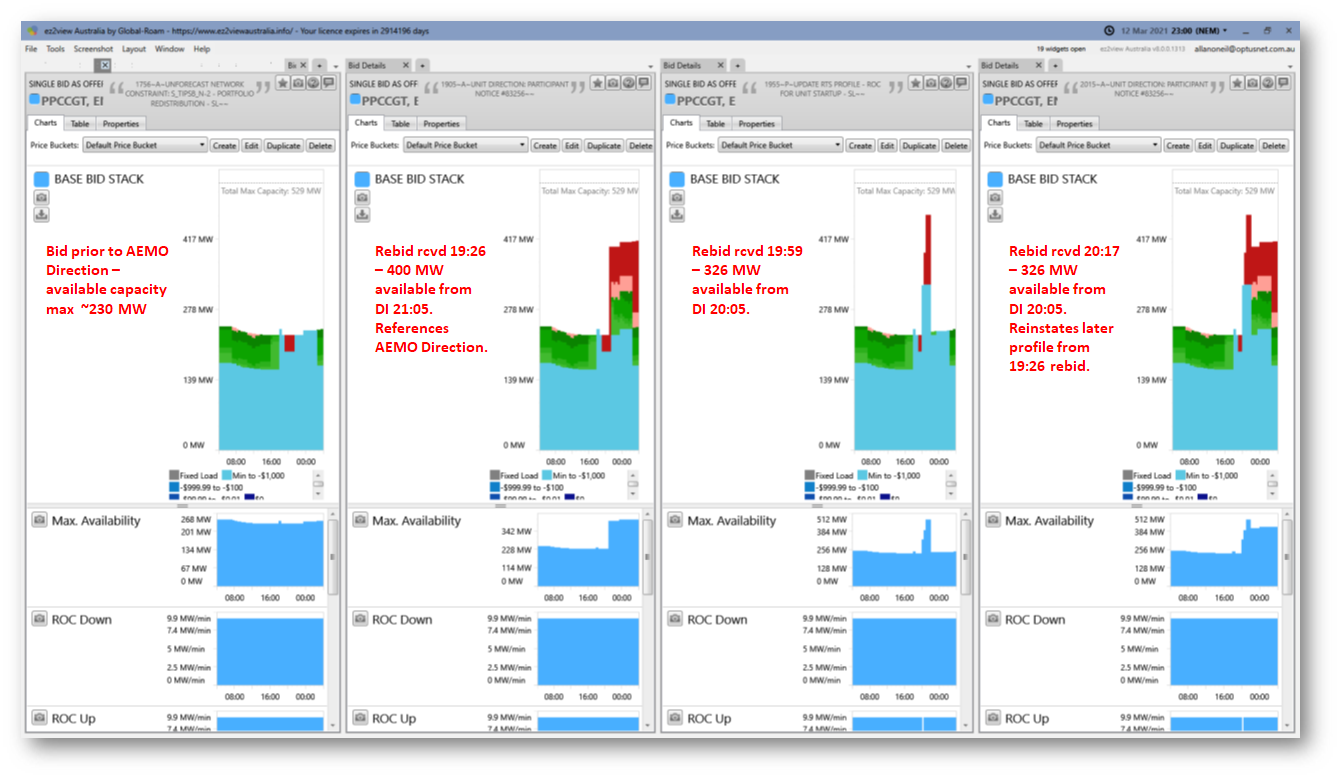
The additional 100 – 170 MW of capacity made available from DI 20:05 by this direction, together with TIPS B3 and B4 staying online, were clearly vitally important factors in maintaining uninterrupted supply over the critical period between DI 19:25 and DI 20:10, during which the spot price sat continuously between $11,000/MWh and $15,000/MWh.
Microdetail 3 – Interconnector Limits
Once Pelican Point’s second GT had started and the question of keeping Torrens Island online was resolved, it might have seemed that the worst of the supply crisis was over by around 21:00 NEM time. But then another extended period of price volatility emerged between DIs 22:35 and 23:35.
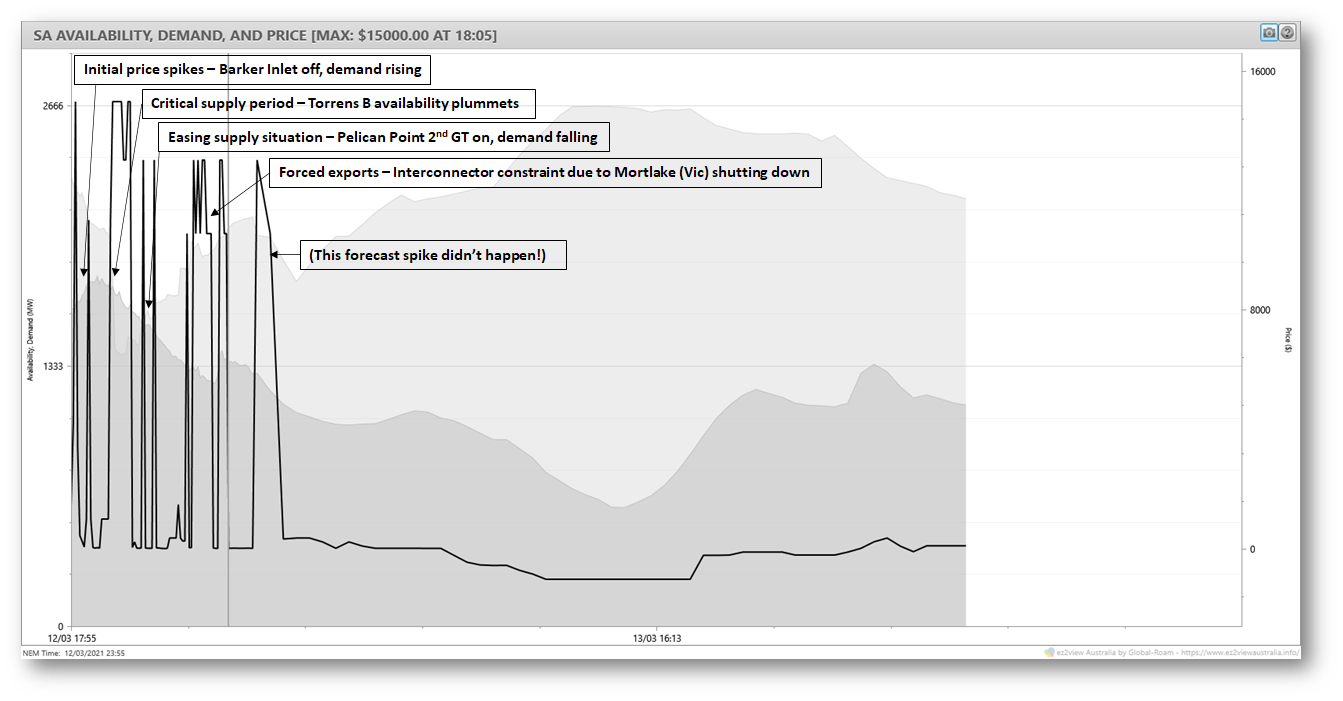
It seems that the driver for this was probably an outage-related system strength constraint centered on generation in the south-east of South Australia and south-west Victoria that effectively forced flows out of South Australia once Mortlake Power Station went offline at 22:30. Mortlake is the predominant source of system strength in this region, and when offline (and when there is a single-contingency risk of the region becoming isolated from the rest of Victoria, as there was due to the transmission line work in progress), the constraint “V_MLMO_VS_LB_CAN_50” – what’s in a name eh? – became binding and limited total westward flows from this region into the rest of South Australia to 50 MW (see the constraint description below).

With local generation (predominantly at Ladbroke Grove) higher than this 50 MW figure, the only way for the excess to flow was out of South Australia, shown on the following chart.
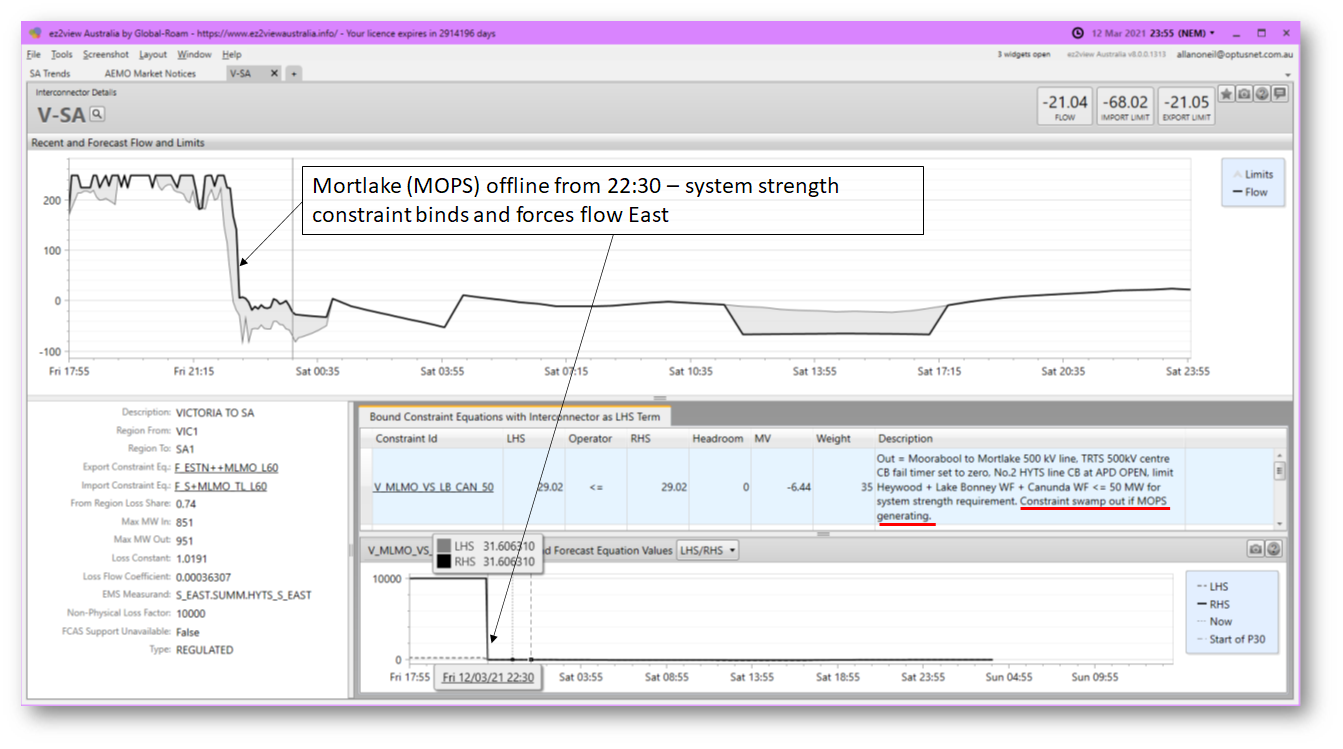
This effectively reduced available supply into South Australia by over 200 MW, and likely accounted for the final period of volatility on a night that had already proved quite difficult enough.
Author: Allen O’Neil
The views and opinions expressed in this article are the author’s own, and do not necessarily reflect those held by pv magazine.
This content is protected by copyright and may not be reused. If you want to cooperate with us and would like to reuse some of our content, please contact: editors@pv-magazine.com.


By submitting this form you agree to pv magazine using your data for the purposes of publishing your comment.
Your personal data will only be disclosed or otherwise transmitted to third parties for the purposes of spam filtering or if this is necessary for technical maintenance of the website. Any other transfer to third parties will not take place unless this is justified on the basis of applicable data protection regulations or if pv magazine is legally obliged to do so.
You may revoke this consent at any time with effect for the future, in which case your personal data will be deleted immediately. Otherwise, your data will be deleted if pv magazine has processed your request or the purpose of data storage is fulfilled.
Further information on data privacy can be found in our Data Protection Policy.