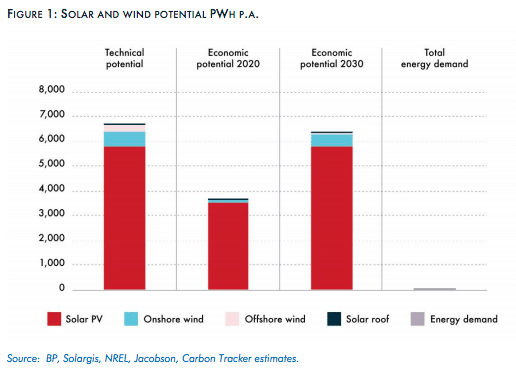
Using current technology and available locations, it would be possible to capture at least 6,700 petawatt hours per annum from solar and wind, which is more than 100 times global energy demand, a report from think tank Carbon Tracker has found.
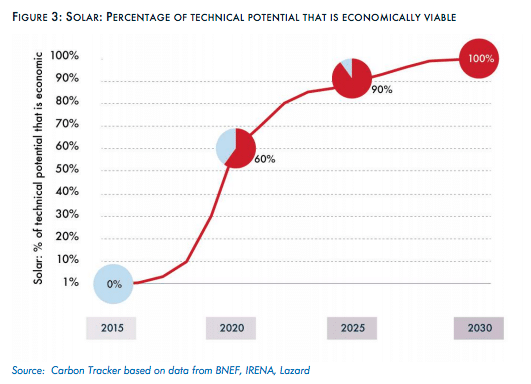
Furthermore, the collapse of the cost of renewables in the last three years means half of this solar and wind potential is now economically viable, and by the end of the decade it will be over 90%.
“The technical and economic barriers [for renewables] have been crossed and the only impediment to change is political,” said the report, which was authored by Carbon Tracker’s Kingsmill Bond, Ed Vaughan, Sam Butler-Sloss, as well as Harry Benham from think tank Ember-Climate.
The lucky country
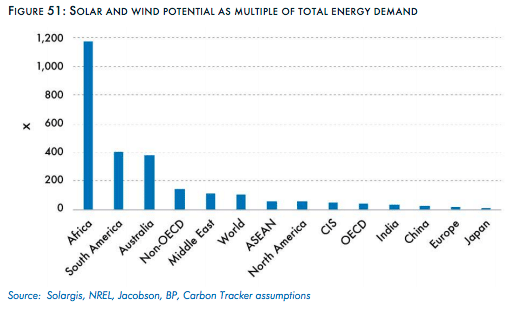
Australia, along with Africa South America “stand out as having huge technical potential compared to energy demand,” the authors found.
“In terms of the renewable energy potential per person, Australia is in a league of its own with over 10,000 MWh per person per annum. With vast renewable potential and a low population, it is thus well positioned to become the battery of the world.”
The authors caveat this, however, noting that Australia’s geographic characteristics may not necessarily lend themselves for exports.
Due to Australia’s abundance of space, the report says its unlikely Australia (like Africa and Russia) will need to invest much in offshore wind platforms.
Solar could even go it alone
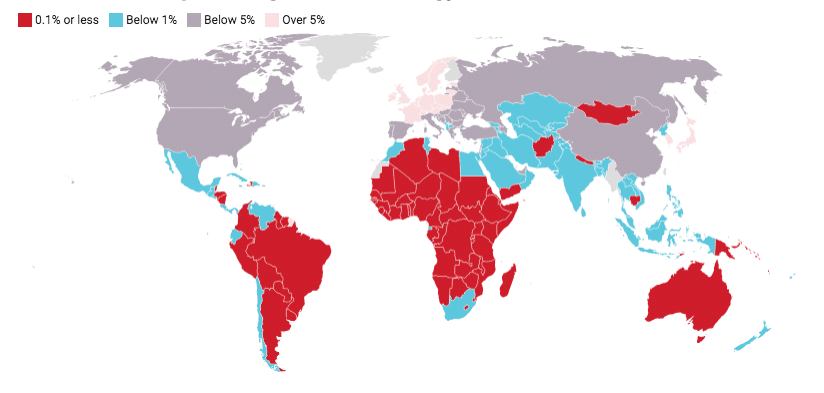
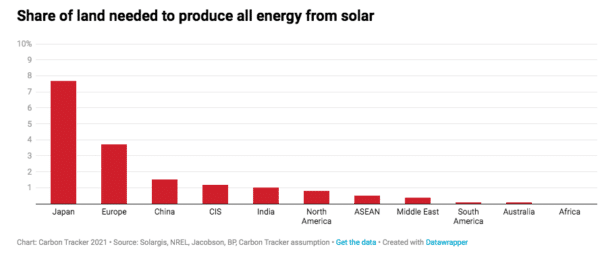
The report also looked into the land required to power the world only from solar PV panels, finding that 450,000 square kilometres would be needed, just 0.3% of the global land area, which is 149 million square kilometres. This obviously variously between countries – with Australia again in luck, ranking among the world’s most abundant.
Interestingly, Carbon Tracker says the space needed to fit enough solar panels to power the world is actually less than the land required for fossil fuels today, which in the U.S. alone is 126,000 square kilometres or 1.3% of the country.
At wind and solar’s current growth rate between 15% to 20%, the think tank forecast that fossil fuels will be pushed out of the electricity sector by the mid-2030s and out of total energy supply by 2050.
Poor countries, rich potential
Countries in the global south are the greatest beneficiaries of the shift towards solar and wind. “They have the largest ratio of solar and wind potential to energy demand and stand to unlock huge domestic benefits,” the report outlines.
“The continent of Africa for example is a renewables superpower, with 39% of global potential,” it finds.
More specifically, countries like Namibia has a renewables potential more than 1,000 times their energy demand. On the other end of the spectrum are countries like South Korea, which has a potential just 10 times its energy demand.
Germany, an outlier and a cause for hope
Germany is another example of a country with low potential and high demand. While it is a prime example of an industrial country, Germany has the third lowest solar and wind resources in the world compared to its total demand. That is, Germany is not very sunny, densely populated, and has high energy demand.
Nonetheless, it’s a global renewables leader. “If the Germans can find solutions, then so can everyone else,” authors of the report write.

This content is protected by copyright and may not be reused. If you want to cooperate with us and would like to reuse some of our content, please contact: editors@pv-magazine.com.


Nice article – fossil fuels need to be pushed out of the market NOW – 100% gone should be the goal. Solar and Wind are cheaper than any other electricity generator worldwide and they have been for over a DECADE the problem has been that the Levelized Cost of Energy (LCOE) for fossil fuel plants has been understated for decades because of the incorrect assumption that the capacity level of each plant will remain steady for the entire life of the plant. the capacity level is dropping weekly as wind and solar replace their power much cheaper and the capacity of the fossil fuel plants has been dropping for years. Some coal plants is the UK NOW had a capacity level at the beginning of their 20-30 years lives and for the first 10 it averaged under 50, but the projection for the remaining .operating time uses the original capacity number which is totally incorrect. GO ti this site and click on the top report it is simply shocking that this kind of error could be prevalent for so long
https://www.rethinkx.com/energy-reports