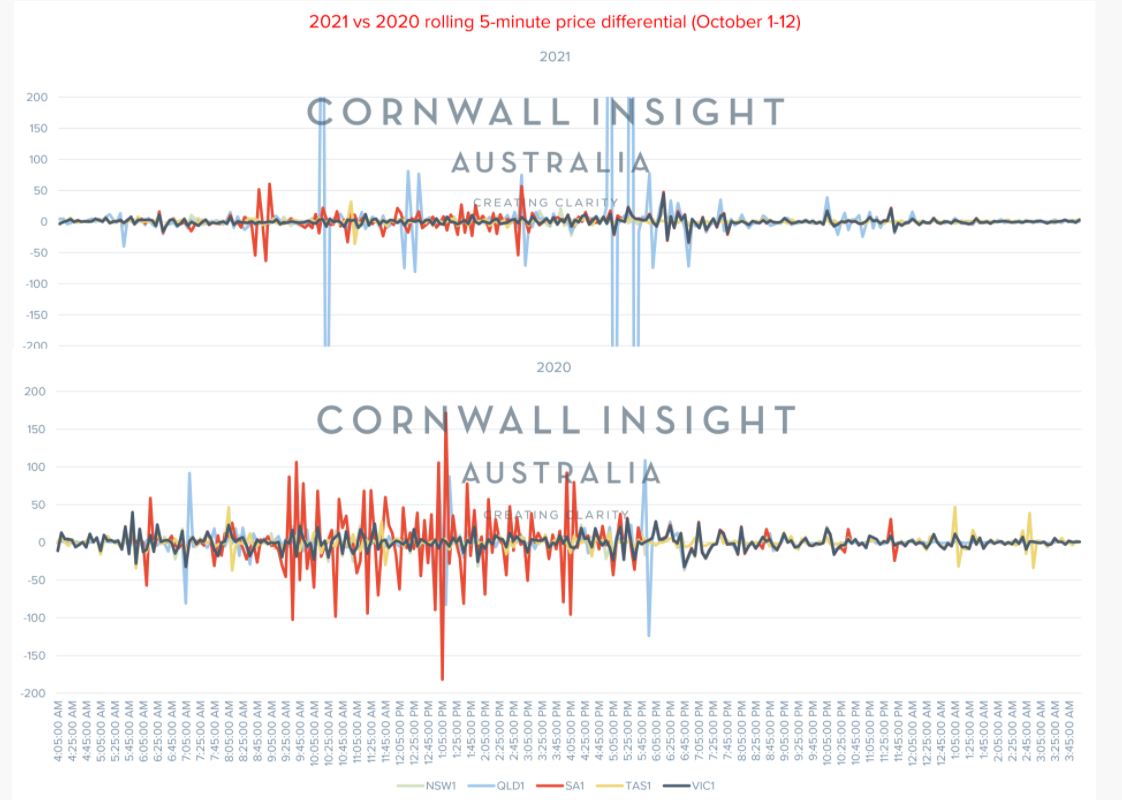
In this Chart of the Week, we look at the difference in consecutive 5-minute price intervals (i.e. how much the price moves from one 5-minute period to the next as a measure of volatility) comparing the same period in October (1-12) from 2020 and 2021.
Interestingly, what we can see in the graph is that in 2020, South Australia (SA) saw a significant amount of volatility during the middle of the day as it struggled with rooftop solar penetration, which has mostly disappeared in 2021.
The volatility in SA in 2020 makes the graph appear as though there was more volatility in 5-minute pricing in 2020 than in 2021, however what we see is that the volatility is focused on SA and not across the wider National Electricity Market (NEM) regions. In this time period in 2020 there were 49 5-minute periods over $300/MWh – 40 of these (or more than 80%) were in SA.
In 2021 there were only 24, but more than 70% of these were in Queensland. Under the new 5-minute settlement, it appears that when those price oscillations do occur, the magnitude of the deviations can be significant. We can see this most notably in Queensland.
During the last couple of weeks, we also saw three instances of prices over $5,000/MWh all of which occurred in Queensland, compared to none at all across the NEM during this same time period last year. One of these periods saw prices go from $200/MWh, up to the market cap, and then back down to $200/MWh over three 5-minute periods.
We cannot yet attribute these large movements solely to the new settlement regime without more long-term data.
We are, however, seeing significantly more negative-priced periods across all states.
Total instances of negative prices rose from just over 2,000 5-minute periods in 2020 to more than 5,000 5-minute periods in 2021 – an increase of more than 140% (just under 250 additional hours). Victoria had more than 700 more instances than this period in 2020, and New South Wales (NSW) saw an increase in negative intervals from only 10 to over 500 (a more than 700% increase).
Again, not all of this can be attributed to the new 5-minute settlement, as this has also been driven by market conditions which saw minimum demand for the NEM broken earlier this month. The magnitude of the negative prices decreased in SA (-35%), Victoria (-9%) and Tasmania (-44%), but increased significantly in NSW (712%) and Queensland increased only slightly (10%).
At the same time as seeing an increased number of negative priced intervals, we have also seen a simultaneous reduction in both the volumes and prices at which renewable assets are willing to offer into the NEM. Interestingly, this hasn’t yet resulted in declining negative priced periods.
Between August and October, Solar plants across the NEM removed roughly half of their volumes ~30MW from their lowest priced bid band (~-$900/MWh) to slightly lower negative bands of around -$240/MWh and -$23/MWh. Wind also removed volumes from its lowest bands by about 30% or ~30MW into price bands around -$40 and -$2. Neither coal nor hydro have made any substantial changes to their bidding volumes or prices.
The ability to capture these price peaks, maximise (if you are storage) or minimise the impact of increased negative price periods, and understand the drivers of these changes will be paramount to developing a successful project in the NEM.
Author: Ben Cerini, principal consultant, Cornwall Insight
The views and opinions expressed in this article are the author’s own, and do not necessarily reflect those held by pv magazine.
This content is protected by copyright and may not be reused. If you want to cooperate with us and would like to reuse some of our content, please contact: editors@pv-magazine.com.


By submitting this form you agree to pv magazine using your data for the purposes of publishing your comment.
Your personal data will only be disclosed or otherwise transmitted to third parties for the purposes of spam filtering or if this is necessary for technical maintenance of the website. Any other transfer to third parties will not take place unless this is justified on the basis of applicable data protection regulations or if pv magazine is legally obliged to do so.
You may revoke this consent at any time with effect for the future, in which case your personal data will be deleted immediately. Otherwise, your data will be deleted if pv magazine has processed your request or the purpose of data storage is fulfilled.
Further information on data privacy can be found in our Data Protection Policy.