From Watt Clarity
As noted before, there’s been a cacophony of commentary (at all different points of the the Emotion-o-meter) stemming from recent announcements which we view under a heading of ‘The Messy Collapse of Coal’ (something we wrote about in some detail inside GenInsights21).
1) Hence it was an uncanny coincidence that one of the largest coal units saw fit to trip on Monday 21st February, with the trip being being a major contributor to the spike that occurred in the NSW and QLD regions on Monday afternoon.
2) Understandably there have been a number of people (including RenewEconomy here) highlight this event as an example of some pretty simplistic thinking inside of the Federal Government. Does not take long on social media to find others echoing this thought (to be frank, the Federal Government’s making it very easy for critics to poke holes):

… but in all the political point scoring (from both ‘sides’) are we not losing sight of the bigger picture?
(A) South Australia spike on Wednesday 23rd February 2022
Today in South Australia, the market appears to have received a reminder that NEMDE is technology agnostic, and that all types of technologies can experience their own challenges leading to price volatility.
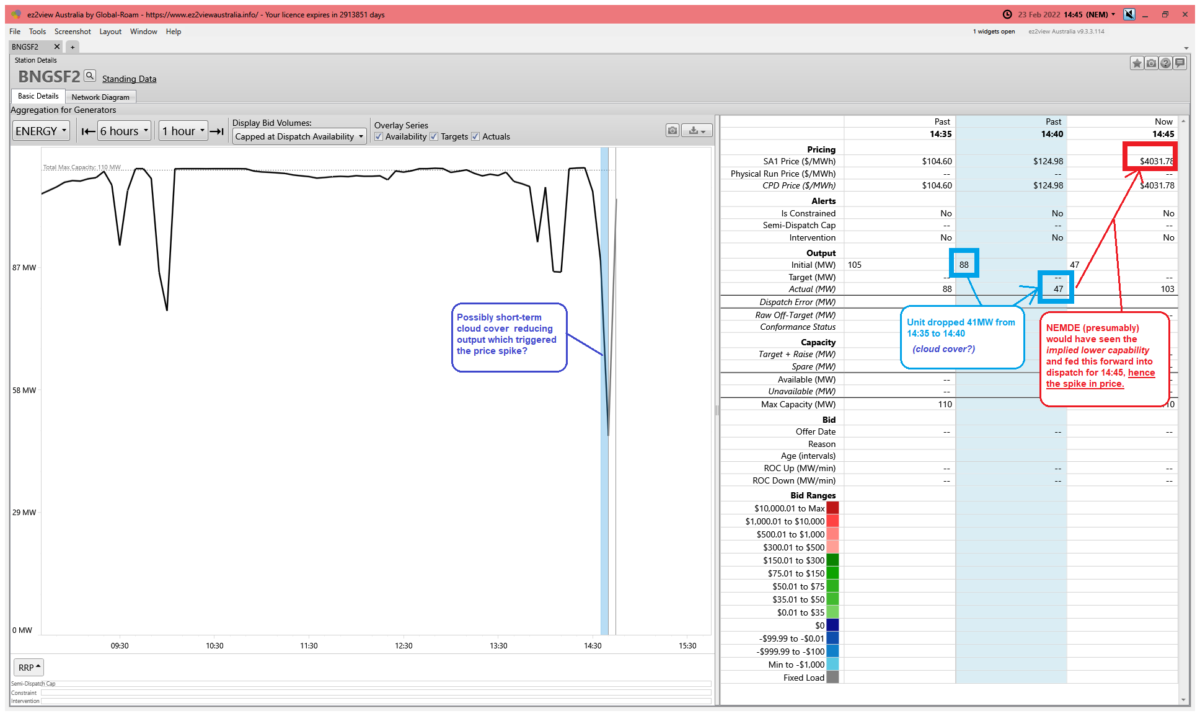
The 5-minute dispatch in the South Australian region spiked to $4,031.78/MWh … so not as high as was the case in NSW on South Australia, but with bid volumes so thin at such high price levels it probably would not have taken much more for the price to pop all the way to the Market Price Cap (currently $15,100/MWh).

As with every price spike there is almost always more than one factor contributing – and this appears to be the case today in South Australia. Here’s three for a start, related to the numbering on the above snapshot from ez2view at 14:45 (NEM time).
(1) Interconnectors constrained
It’s a pretty rare event when prices spike and interconnectors are unconstrained right across the NEM … on Monday it was the VIC-NSW interconnector and today it was the Heywood and Murraylink interconnectors.
(2) Very low wind harvest
Based on the constraint data publicly available at this time it does not appear that any wind farms in South Australia were constrained at this point in time (e.g. for System Strength reasons, or due to local network limits), and with healthy prices it seems highly unlikely that any wind farms have bid themselves out of the market – which leads to the conclusion that it’s low wind conditions leading to aggregate output of barely 100MW at this point in time across all Wind Farms in South Australia.
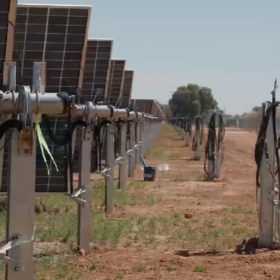
(3) Sudden drop in output at Bungala 1 and Bungala 2 Solar Farms
The red colour coding in the image above has resulted from a sudden increase in output – from the ‘Final MW’ level metered at 14:40 to the ‘Final MW’ level metered at 14:45 (note that ez2view is in Time Travel Mode here).
What’s more important from a NEMDE perspective is the sudden drop that occurred in the 5 minutes preceding this. Both BNGSF1 and BNGSF2 dropped output in between 14:35 and 14:40 – with BNGSF2 being the slightly larger drop (41MW, or a drop in output of almost 50% of what it had been beforehand), as shown in the ‘Unit Dashboard’ widget in ez2view here:

Note that the table has been focused on the (prior) 14:40 dispatch interval, which shows the drop in output – which we presume* would have fed through into the Availability forecast for both units for the 14:45 dispatch interval … which (given the lack of wind and import capability) would have triggered the price spike.
* there’s not full visibility of what’s happening within the market within the ‘Current Day’ so we need to make some assumptions
(B) Increasingly on a Knife Edge?
As noted before, we released GenInsights21 on 15th December 2022, and since then, the readership has continued to grow.
One of the early readers of the publication was Bella Peacock from PV Magazine … and one of the conclusions that jumped out at Bella from the report was that …
“In summary: our electricity generation is becoming more variable and uncertain, which is not necessarily bad but does add layers of complexity to a system already piling them on faster than a game of Uno. Each of these layers of complexity is shadowed by an additional layer of risk.
New risks mean new premiums. Which leads us to the question, who pays? Again, you get the picture. Clusterf*ck.”
For those who have an interest, here’s some of the other comments people have made about GenInsights21.
In essence, what happened on Monday in NSW and what happened today in South Australia are both examples of the same underlying dynamic … the NEM is increasingly sitting on a knife edge, with not much required (i.e. any type of ‘trip’, for instance) to tip it ‘over the edge’.
Again this week I am wondering whether it’s possible for us all to collectively cool the ideological barrage and really think through what we’re expecting to happen as we move together through this energy transition….
Author: Paul McArdle, CEO & founder of WattClarity
The views and opinions expressed in this article are the author’s own, and do not necessarily reflect those held by pv magazine.
This content is protected by copyright and may not be reused. If you want to cooperate with us and would like to reuse some of our content, please contact: editors@pv-magazine.com.

By submitting this form you agree to pv magazine using your data for the purposes of publishing your comment.
Your personal data will only be disclosed or otherwise transmitted to third parties for the purposes of spam filtering or if this is necessary for technical maintenance of the website. Any other transfer to third parties will not take place unless this is justified on the basis of applicable data protection regulations or if pv magazine is legally obliged to do so.
You may revoke this consent at any time with effect for the future, in which case your personal data will be deleted immediately. Otherwise, your data will be deleted if pv magazine has processed your request or the purpose of data storage is fulfilled.
Further information on data privacy can be found in our Data Protection Policy.