The total output of rooftop solar over summer was 8,046 GWh, up by 19.5% on the previous year, the Clean Energy Council said. These figures come in spite of the fact Australia had less sunshine than normal over summer – a testament to the cumulative force of rooftop solar’s normalisation.
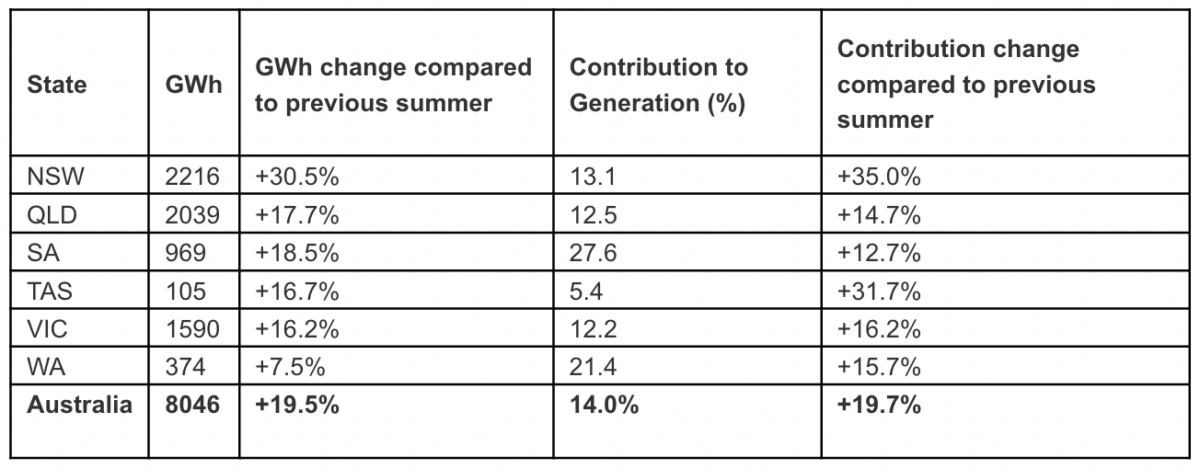
Image: Clean Energy Council
The Clean Energy Council says the 15% – 20% increase in Australian’s electricity bills in 2022 have underpinned strong demand for rooftop solar. The rising power price has also made rooftop solar’s payback times even more attractive, hitting near record-low at 3.4 years for a 7 kW system.
“We’re seeing a fundamental shift; consumers are becoming energy generators,” Clean Energy Council Chief Executive Kane Thornton said. Thornton also noted these figures measure only what enters the grid.
Breaking down the states, New South Wales’ (NSW) rooftop solar generation jumped 35% on the previous summer. Tasmania also saw a massive uptick, clocking a 31.7% jump from the previous year.

Image: Clean Energy Council
Using data from the Clean Energy Regulator, the Council also noted top postcodes for rooftop solar uptake, with Lismore claiming the top spot for NSW, Bundaberg for Queensland, Salisbury in South Australia, Hoppers Crossing in Victoria, Mandurah in Western Australia, and Blackstone Heights in Tasmania.
Home battery installations are also growing, with 7% of new solar systems now including a battery.
In total, 2.8 GW of rooftop solar was installed in 2022.
This content is protected by copyright and may not be reused. If you want to cooperate with us and would like to reuse some of our content, please contact: editors@pv-magazine.com.



Hello.
In the table “Top rooftop solar postcodes in 2022”, is the ranking by percentage of households, or, by absolute numbers of installations?
I am in postcode 6112, the third highest in WA, so, this is of particular interest to me, especially, with me sending a reference to this report and the table, to my local news publication.
And, thank you for the report, and, for your ongoing informative work in this field.
Hi Bret, thanks for your comment! It is in absolute install numbers, specifically rated output in kW. You can find the data the Clean Energy Council used to generate that table on the Clean Energy Regulator’s website: https://www.cleanenergyregulator.gov.au/RET/Forms-and-resources/Postcode-data-for-small-scale-installations#Postcode-data-files
Cheers!