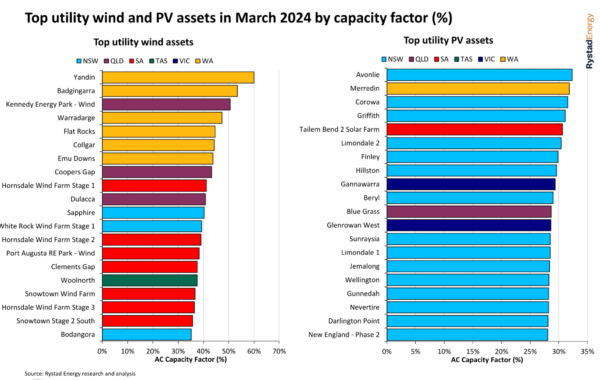
Data from Rystad Energy shows that all Australian large-scale PV and wind assets generated 4,102 GWh of clean energy in March 2024, up from 3,512 GWh in the same period last year with New South Wales (NSW) home to 15 of the top 20 best-performing utility PV assets for the month.
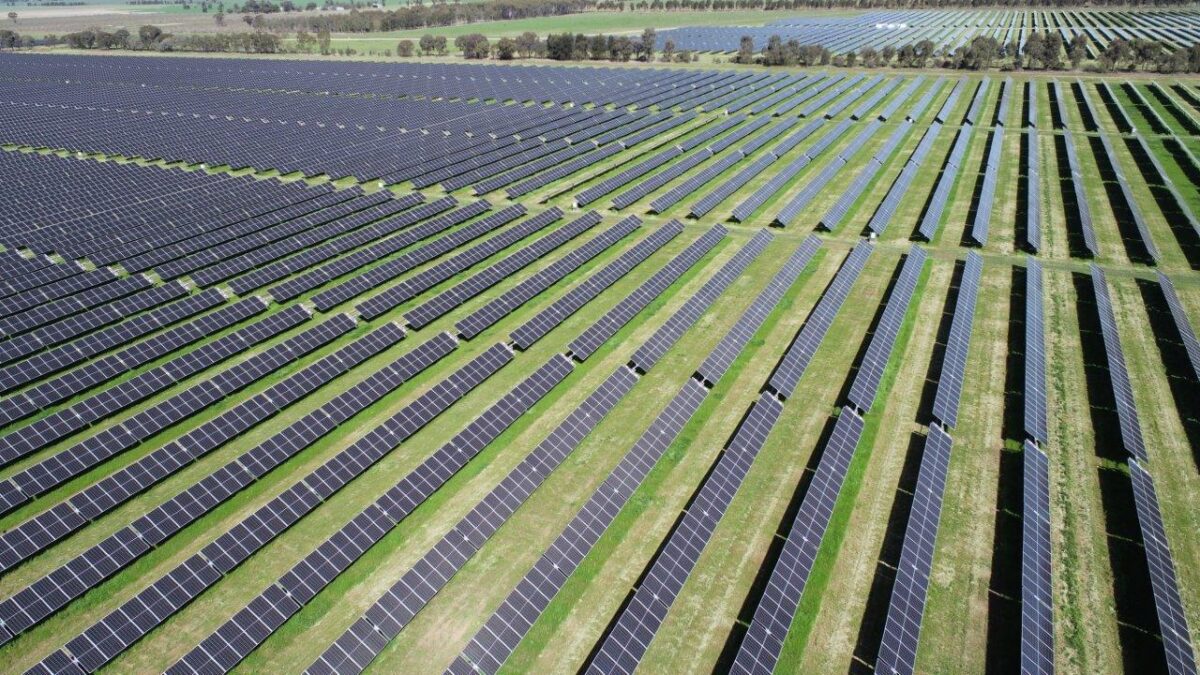
Iberdrola’s 245 MW Avonlie Solar Farm was ranked Australia’s best performing large-scale PV asset with Rystad Senior Analyst David Dixon noting the NSW Riverina region facility had delivered an average AC capacity factor (CF) of 32.3% for the month.
The Avonlie power plant was followed by SUN Energy’s 100 MW Merredin Solar Farm in Western Australia, with a capacity factor of 31.8%, and Metka’s 30 MW Corowa Solar Farm in southern NSW with a 31.6% AC CF.

Dixon said the 670 GWh of clean energy generated by NSW solar farms was a new March record for utility PV generation in the state while Queensland, Victoria and South Australia also reached new highs in March 2024.
“The key driver for utility PV records being broken was mostly to do with asset performance getting better, that is better overall capacity factor of the fleet of utility solar assets,” he said. “There was also a minor amount more utility PV capacity energised in March 2024 (8.3 GW) versus March 2023 (8.1 GW).”
While large-scale solar assets delivered a record-breaking performance, so too did utility wind facilities with new March highs set in Western Australia, Queensland and South Australia.
Dixon said this was mostly due to new wind capacity energising over the prior 12 months, including Octopus Energy’s Dulacca wind farm in Queensland and Enel Green Power’s Flat Rocks wind farm in Western Australia.
Western Australian wind farms dominate the performance stakes with the state home to six of the top seven performing assets with Ratch Australia’s Yandin wind farm leading the way with a 60% capacity factor.
This content is protected by copyright and may not be reused. If you want to cooperate with us and would like to reuse some of our content, please contact: editors@pv-magazine.com.


The article mentions:
“The key driver for utility PV records being broken was mostly to do with asset performance getting better, that is better overall capacity factor of the fleet of utility solar assets,”
What do you think that created this, more sun light, panels being cleaned, better management etc.