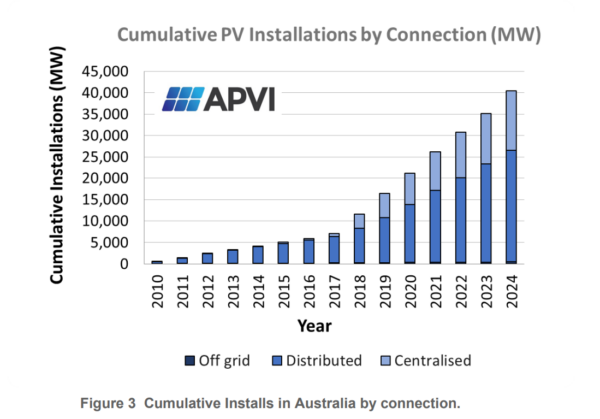
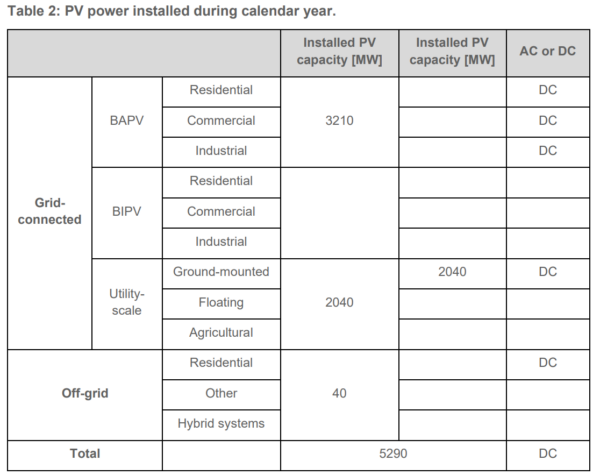
An International Energy Agency (IEA) survey of solar power applications in Australia shows 5.2 GW of installations in 2024 were achieved and the total capacity of solar at 40 GW, includes 26.1 GW of distributed systems and 13.4 GW of centralised installations.
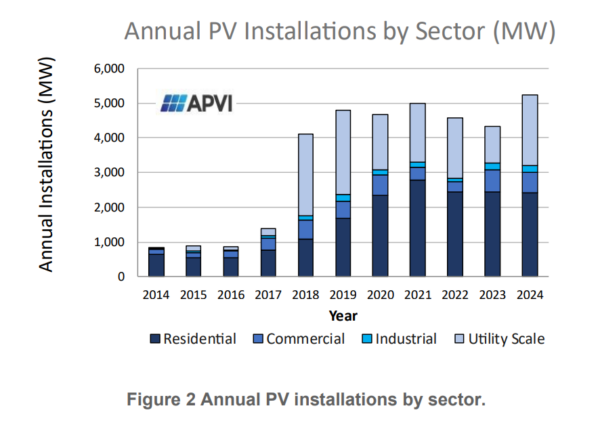
5 MW or over utility-scale installations completions contributed 2 GW, and rooftop installations on residential, commercial and industrial contributed 3.2 GW to the annual total.
Solar installations in 2024 also exceeded in one year the cumulative total of all installations up to the end of 2015, which was 5.1 GW.
“Despite recording a record volumne of installations in 2024, Australia did not rank among the world’s top ten markets for annual installations. This marks the second consecutive year outside the top ten, a position it has held since the IEA photovoltaic power systems program (PVPS) began tracking markets in the 1990s,” the report says.
Rooftop solar
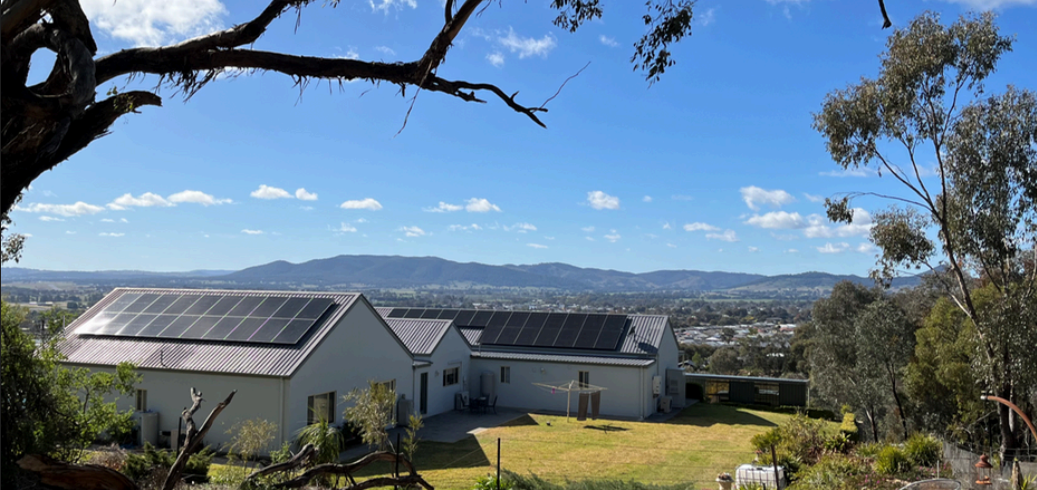
For rooftop solar Australia outranks most nations, where 44% of free-standing homes have solar installed, including approximately 50% of homes each in Queensland and South Australia (SA).
“With low insolation relative to the rest of Australia (3.7 kWh per year), Tasmania has only 20% of free-standing homes powered by solar PV,” the report says.
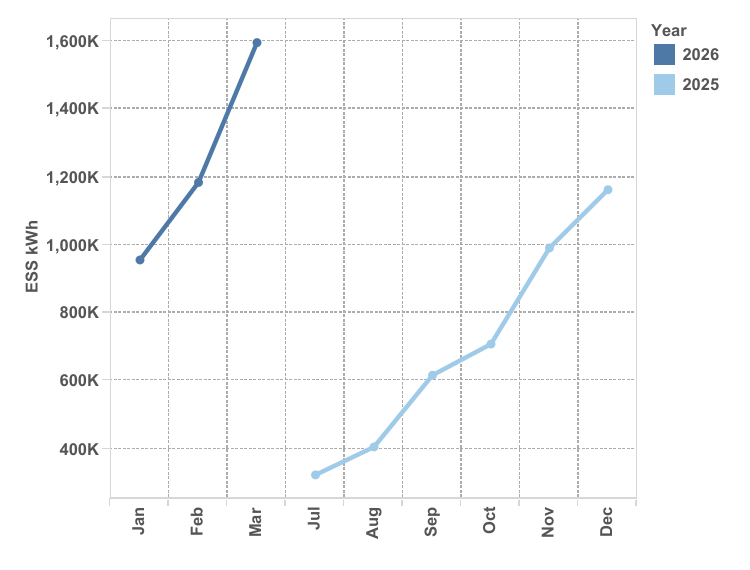
“South Australia, with a population of 1.77 million, rooftop solar alone has routinely been sufficient to power the state with excess power from rooftop and large scale being exported to neighbouring states for over the four hours around mid-day.”
A trend toward larger residential systems has seen residential and commercial rooftop solar reclassified for average sizes, which for residential has previously been 1o kW or less (up from 3 kW in 2012), to now be up to 15 kW, and commercial systems classified between 15 kW to 100 kW.
Utility solar
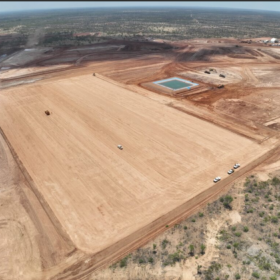
The report notes Australia’s ambition for utility scale solar fall into the 10 to 30 GW segment, yet despite incentives like the Capacity Investment Scheme (CIS) and its target of 40 GW, issues related to connection approvals, congestion management, and fragmented access arrangements increase costs and risks for grid-scale projects, the report finds.
Australia is also in the top ten globally for total installed capacity and reflects a world leading installation rate of greater than 1.52 kW per capita.
“With an impressive total 26.1 GW of distributed solar and an additional 13.4 GW total centralised solar, combined with excellent insolation, solar power now meets over 20% of the nation’s total electricity demands,” the report says.
The National Survey Report of PV Power Applications in Australia 2024 lists University of New South Wales (UNSW) Australian Centre for Advanced Photovoltaics Director Professor Renate Egan as the main author, but also includes experts from six other Australian universities and clean energy specialist businesses.
This content is protected by copyright and may not be reused. If you want to cooperate with us and would like to reuse some of our content, please contact: editors@pv-magazine.com.


1 comment
By submitting this form you agree to pv magazine using your data for the purposes of publishing your comment.
Your personal data will only be disclosed or otherwise transmitted to third parties for the purposes of spam filtering or if this is necessary for technical maintenance of the website. Any other transfer to third parties will not take place unless this is justified on the basis of applicable data protection regulations or if pv magazine is legally obliged to do so.
You may revoke this consent at any time with effect for the future, in which case your personal data will be deleted immediately. Otherwise, your data will be deleted if pv magazine has processed your request or the purpose of data storage is fulfilled.
Further information on data privacy can be found in our Data Protection Policy.