With over 1,200 MW of new large-scale solar and wind capacity commencing generation during the period, Q3 2018 saw the highest variable renewable energy (VRE) output on the National Electricity Market (NEM) of more than 20% of the supply mix.
According to AEMO’s latest Quarterly Energy Dynamics report, average large-scale wind and solar generation in Q3 2018 increased by 20% on the year to 2,255 MW, making up 10% of the supply mix, up from 8% in Q3 2017.
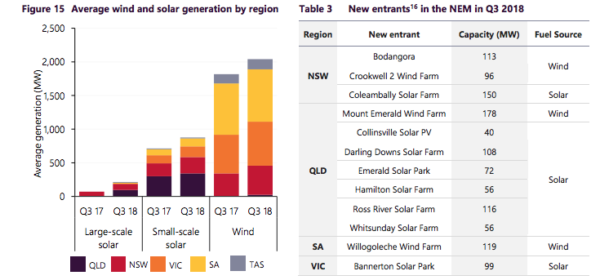
In addition to the unprecedented flood of large-scale solar PV project in the NEM, Q3 2018 was the first quarter on record in which wind output exceeded gas-powered generation and AEMO also observed the highest hydro generation output across a quarter since 2013.
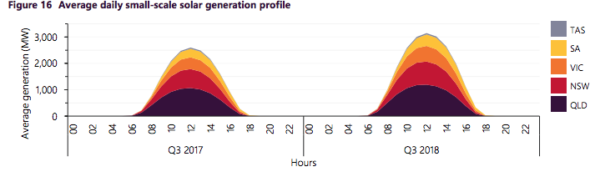
Meanwhile, average small-scale PV generation increased 23% YoY to 875 MW. The average peak generation of the rooftop fleet reached 3,285 MW up from 2,714 MW in 2017.
The AEMO also reports that the South West Interconnected System (SWIS) of Western Australia passed the 1 GW milestone of rooftop PV and solar farm capacity installed, noting that the high share of small-scale PV – with 26.7% WA is the third largest market in terms of rooftop solar penetration – has led to an increase in the occurrence of negative prices causing a drop in minimum daytime demands.
Record curtailment in SA
The market operator has also reported it had to intervene in the South Australian market for around 40% of the time during the quarter in order to ensure the power system security. As a result, around 10% of VRE output in the region was curtailed in Q3 2018.
“During Q3 2018, total curtailments of non-synchronous generation (large-scale wind and solar farms) in South Australia increased to around 76 GWh (or 10% of South Australian non-synchronous generation), with curtailment occurring for 26% of the time during the quarter,“ the report reads.
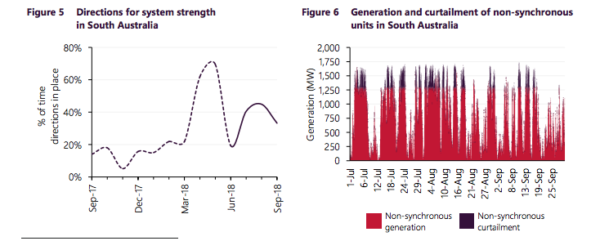
The main reasons behind the need for curtailment were record high wind generation and insufficient synchronous generators being available to meet system strength requirements, the AEMO says, noting that the cost of interventions was at around $7.4 million.
On the bright side, Q3 2018 was also the quarter that South Australia recorded its lowest minimum demand on Sunday 30 September 2018. However, that record was broken three weeks later on Sunday 21 October 2018.
Mixed wholesale electricity prices
Overall, average wholesale electricity prices were lower in all regions than in the corresponding period last year.
There was a mixed bag of prices across the NEM, with Victoria (-$19/MWh) and South Australia (-$8/MWh) experiencing a reduction, and New South Wales, Queensland and Western Australia observing a slight increase in the average price over the period.
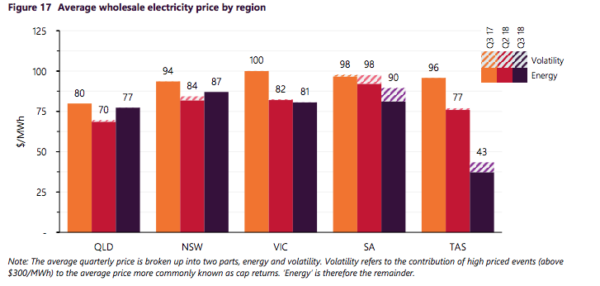
According to the AEMO, lower prices in Victoria and SA were a function of temporal factors such as higher hydro output, as well as more persistent factors such as new supply from large-scale solar and wind coming online.
The price increase in NSW, for instance, were attributed to reduced availability and generation from the black coal-fired fleet.
The NSW coal-fired fleet recorded its lowest availability since Q2 2016, largely due to extended unit outages at Bayswater and Vales Point power stations – the shortfalls the latter is looking to address by adding a 55 MW solar farm.
This content is protected by copyright and may not be reused. If you want to cooperate with us and would like to reuse some of our content, please contact: editors@pv-magazine.com.


By submitting this form you agree to pv magazine using your data for the purposes of publishing your comment.
Your personal data will only be disclosed or otherwise transmitted to third parties for the purposes of spam filtering or if this is necessary for technical maintenance of the website. Any other transfer to third parties will not take place unless this is justified on the basis of applicable data protection regulations or if pv magazine is legally obliged to do so.
You may revoke this consent at any time with effect for the future, in which case your personal data will be deleted immediately. Otherwise, your data will be deleted if pv magazine has processed your request or the purpose of data storage is fulfilled.
Further information on data privacy can be found in our Data Protection Policy.