One of the most striking aspects of OpenNEM when it launched in February 2018 was the stark differences it showed in electricity supply for five Australian states connected to the National Electricity Market (NEM). The data tool’s development team, Dylan McConnell, Simon Holmes à Court, and Steven Tan, were often quoted saying it showed the different energy “personalities” of Queensland, New South Wales, Victoria, Tasmania and South Australia.
It’s still fascinating to see the distribution of energy sources in any seven-day period (the tool’s default display and its original remit).
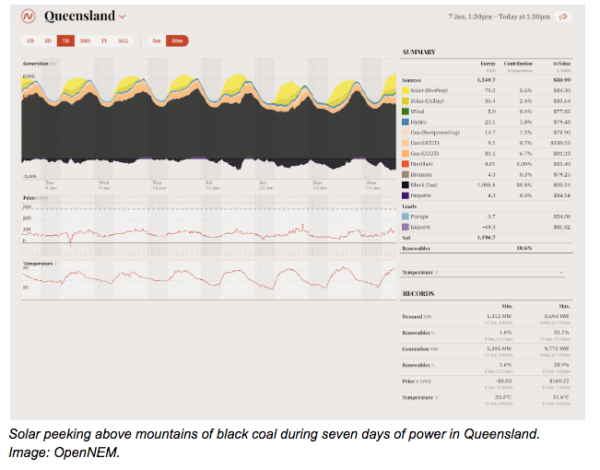
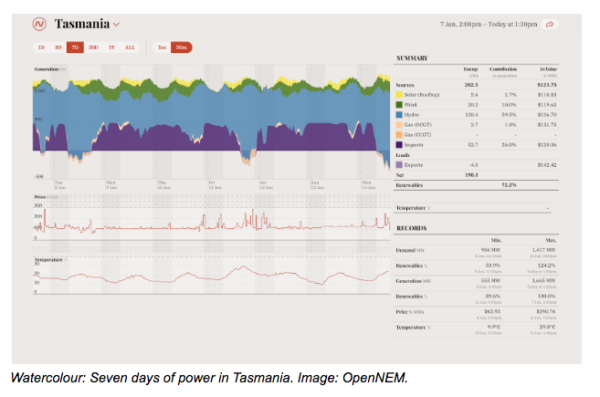
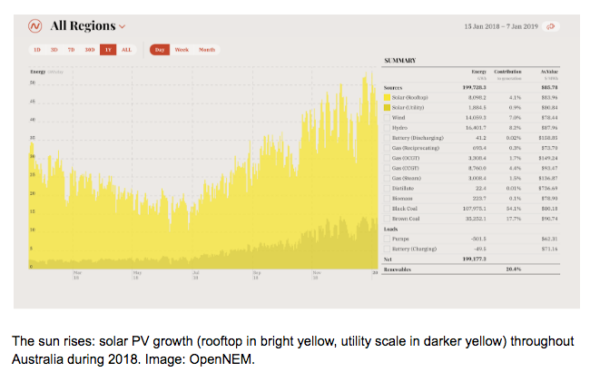
In Queensland, rooftop and utility-scale solar rises brightly over a consistent stream of gas, above mountains of black coal; the blue watercolour of Tasmanian hydro sources is fringed with green wind and golden solar; and the tide of brown coal in Victoria is capped with widening bands of utility solar and sunny yellow rooftop solar sources. In contrast, South Australia offers, says Simon Holmes à Court, “a peek at the future”, with its green wind-powered hills, capped by halos of solar, atop craggy bursts of gas — there’s not a black or brown coal seam in sight.
And aligned with every peak and trough of data drawn directly from the Australian Electricity Market Operator (AEMO) is the cost of electricity at that moment, along with the temperature at that time provided by the Australian Bureau of Meteorology (BOM). The graphs show explicitly what happens to the cost of electricity when solar PV penetration is highest, when wind-generation kicks in, when hydro takes over. It shows at which times of day and at what outdoor temperatures the spikes in electricity use occur.
pv magazine Australia is talking to Holmes à Court as he prepares to go on holiday after weeks of collaborating on the second stage of OpenNEM. With an hour at the airport before take-off, he is excited and proud to take us through the beta-stage v2 of OpenNEM.
If the seven-day view of data was telling, the addition of historical data since 2005 right through to present-day readings, is compelling. It clearly shows the transition of power sources in the NEM with the penetration of renewables, the accompanying price changes, and temperature variations over time.
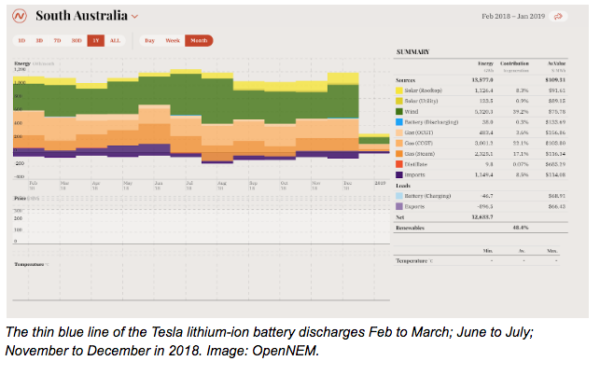
The data — this irrefutable fact bank — shows South Australia’s transition to clean energy, to the point where coal-fired stations were switched off in 2016. It shows the thin blue line of battery generation — representing introduction of the 100 MW lithium-ion Tesla battery — when it has discharged into the grid, what the effect is at those times on South Australia’s imports of electricity from eastern states, and the impact of periods of high penetration of renewables on the electricity price.
Power data is knowledge, a potent myth dispeller. For example, says Holmes à Court, “I always assumed that we use more power in summer than in winter, because of air conditioning.”
He invites us to reset the graph to encompass all regions of the NEM over the entire scope of the data since 2005, and to select the “Season”-al reading. “If you hover over each of those peaks, you’ll see the bumps are often in winter.” His point is that often, even reasonably informed participants and commentators “carry false narratives in the energy space about what’s happening”.
Another common perception refuted by OpenNEM v2, is that South Australia imports large amounts of energy to top up its renewable supply. Resetting the graph to show the past year of data reveals that “over this 12 months South Australia has imported 9% of its power and exported 7%, so it’s a 2% net importer, which is nothing,” says Holmes à Court.
Development of OpenNEM’s core was funded by Energy Consumers Australia, with the intention of improving access to otherwise inaccessible data that is also often impenetrable to people without deep experience in electricity markets.
“ECA wanted people to be able to start from the same fact base,” says Holmes à Court, who adds that, “No opinion comes with OpenNEM, it’s just the data.”
OpenNEM is energy agnostic, and aims to improve energy literacy for those who want to take part in the national discussion about Australia’s energy transition. Commentators and the public can verify or debunk their own beliefs, journalists can fact check their sources against the easily read data output, lobbyists and advocates for energy of every colour can collect truthful statistics.
The historical extension to OpenNEM refutes a broader realm of fake energy news and hyperbole than the original iteration was able to.
The next step for this simple, useful tool, says the trio of developers is to present more granular data showing output of specific energy producers, from individual utility-scale solar and wind farms to each coal-fired or gas-powered station. Look out for v3 around mid-2019.
In the meantime, Simon Holmes à Court says, “I’ll show you one more fun thing…
“Click on All Regions and One Year. Shift-click on Solar (rooftop) in the right-hand menu, then add Solar (utility) as well. On the right side of the graph is how much solar we’re getting now, and on the left is how much solar we were getting a year ago.” This sunny perspective shows the spectacular rise and rise of solar PV in 2018.
Natalie Filatoff
This content is protected by copyright and may not be reused. If you want to cooperate with us and would like to reuse some of our content, please contact: editors@pv-magazine.com.


By submitting this form you agree to pv magazine using your data for the purposes of publishing your comment.
Your personal data will only be disclosed or otherwise transmitted to third parties for the purposes of spam filtering or if this is necessary for technical maintenance of the website. Any other transfer to third parties will not take place unless this is justified on the basis of applicable data protection regulations or if pv magazine is legally obliged to do so.
You may revoke this consent at any time with effect for the future, in which case your personal data will be deleted immediately. Otherwise, your data will be deleted if pv magazine has processed your request or the purpose of data storage is fulfilled.
Further information on data privacy can be found in our Data Protection Policy.