Several grid-scale renewable energy records were once again set in Q4 2019. During the quarter, the National Electricity Market (NEM) generation mix was shaped by a combination of thermal coal outages, dry conditions, and high solar irradiation, the Australian Energy Market Operator (AEMO) has revealed.
Total wind and solar output across the NEM continued to rise. During Q4 2019, average grid-scale VRE generation reached 2,868 MW, representing a 39% increase from last year. VRE generation accounted for 14% of the NEM supply mix in Q4 2019 compared to 10% in Q4 2018, finds AEMO in its latest Quarterly Energy Dynamics report.
The quarter also saw the highest variable renewable energy output on record on the NEM, with 6,396 MW recorded at 13:30 on November 12, and a new high for grid-scale renewables’ share of NEM operational demand, with big solar and wind meeting 32% of NEM operational demand at 14:00 on October 06.
Record big PV output
Over the quarter as a whole, the contribution of big PV was particularly pronounced with average grid-scale solar generation at 825 MW. This was a record high for average quarterly contribution to the NEM and almost double Q4 2018’s output.
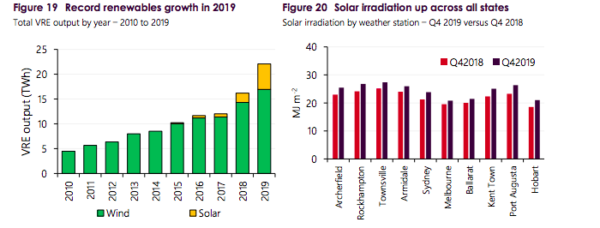
The highest grid-scale solar output on record reached 2,421 MW at 11:00 on 4 December 2019. The significant increase was driven by a combination of increased solar irradiation across all states (Figure 20), recently commissioned projects ramping up production, and new capacity additions in New South Wales, AEMO states.
Queensland generation accounted for the largest growth, representing 62% of total increase, the report states. Growth in grid-scale solar capacity slowed in the second half of 2019: in Q4 2019, only two projects commenced generation (Limondale Solar Farm 229 MW, and Nevertire Solar Farm, 105 MW, both in New South Wales).
Compared to 2018, renewables output increased by 5.9 TWh in 2019, with grid-solar and wind contributing 3.2 TWh and 2.6 TWh respectively. According to AEMO, record variable renewable energy generation growth in 2019 is expected to continue into 2020, as a large amount of new capacity currently being accredited is likely to reach full generation by mid-2020
As forecast by consultancy Rystad Energy, Australia’s utility-scale solar sector is poised for a record year in 2020 with 1.96 GW of projects expected to complete commissioning. Overall, 3.6 GW of renewable energy capacity is expected to complete commissioning, up from 2.6 GW in 2019.
Power prices go down
In Q4 2019, average grid-scale VRE output continued to rise steadily, with a combined 802 MW increase compared to the same quarter in 2018, due to continued ramp-up of recently installed capacity, as well as comparatively high solar irradiation. The record contribution of wind and solar utility-scale projects led to a massive drop in power prices.
Over the quarter as a whole, NEM spot wholesale electricity prices averaged $72/MWh, which is 19% lower than Q4 2018 and represents the lowest quarterly average since Q4 2016. “This was driven by increased supply from wind farms, solar farms, and gas-powered generation (GPG), with combined grid-scale wind and solar output increasing by 39% compared to Q4 2018,” the AEMO states.
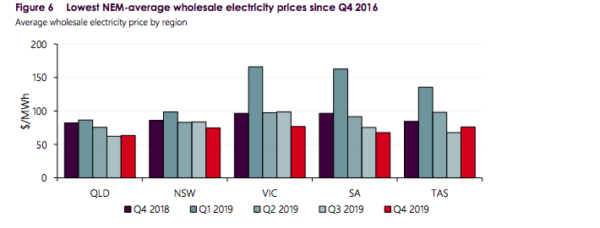
The largest decline occurred in South Australia, averaging $68/MWh in Q4 2019 compared to $96/MWh in Q4 2018, followed by Queensland, at $63/MWh compared to $82/MWh. “These overall low Q4 2019 averages occurred despite a high number of coal-fired generator outages, increased underlying demand, and record-breaking high temperatures, which resulted in price volatility in some regions,” AEMO states.
Curtailment at record high
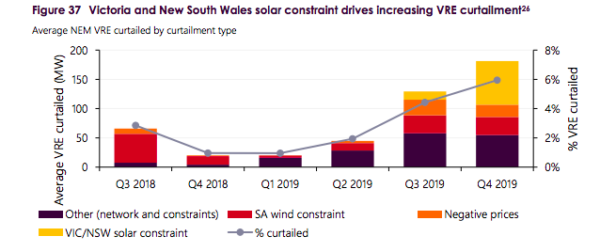
During Q4 2019, NEM-wide solar and wind curtailment increased to 6% of total VRE output, the highest amount on record (Figure 37). This happened mainly due to self-curtailment in response to negative prices, system security constraints on five solar farms (four in Victoria, one in New South Wales), system strength constraints in South Australia, and transmission outages and other network constraints.
According to AEMO, most of these factors contributed a similar amount of curtailment as in Q3 2019, but much higher than historical outcomes. The main increase compared in Q4 2019 to Q3 2019 was the impact of the VIC/NSW solar constraint, with an estimated average curtailment of 75 MW, up from 14 MW in Q3 2019. The increase was due to the constraint being in place for the entire quarter – compared to less than one month in Q3 2019 – as well as sunnier Q4 conditions, AEMO explains.
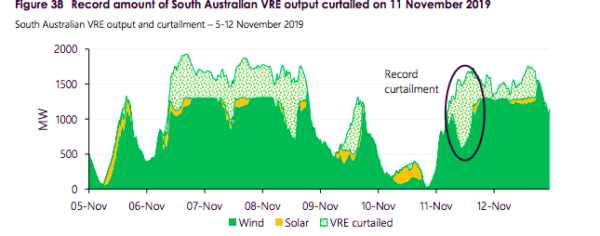
In South Australia, negative prices contributed to an average 21 MW of curtailment or average of 313 MW curtailed during negative price events. The self-curtailment from variable renewable energy projects during Q4 was the largest on days with extended negative spot prices. For example, a record high 968 MW of South Australian VRE output was curtailed at 1300 hrs on 11 November, coinciding with low daytime demand, transmission outages, and a spot price of -$343.33/MWh (Figure 38).
This content is protected by copyright and may not be reused. If you want to cooperate with us and would like to reuse some of our content, please contact: editors@pv-magazine.com.


By submitting this form you agree to pv magazine using your data for the purposes of publishing your comment.
Your personal data will only be disclosed or otherwise transmitted to third parties for the purposes of spam filtering or if this is necessary for technical maintenance of the website. Any other transfer to third parties will not take place unless this is justified on the basis of applicable data protection regulations or if pv magazine is legally obliged to do so.
You may revoke this consent at any time with effect for the future, in which case your personal data will be deleted immediately. Otherwise, your data will be deleted if pv magazine has processed your request or the purpose of data storage is fulfilled.
Further information on data privacy can be found in our Data Protection Policy.