Lower and lower is the forecast for MLFs to be endured by solar farms in New South Wales over the year commencing July 1, according to the Australian Energy Market Operator’s Draft Marginal Loss Factors FY 2021-22, published for consultation last week. Solar operators in other states will be sifting through mixed results in the changes from the previous year’s revenue curbing.
New South Wales is particularly hard hit because local generation has increased, and demand that draws imports from Queensland and Victoria will add to congestion in the network until major transmission upgrades between states, and those funnelling output from renewable energy zones come online in future years.
The Riverina region gets the roughest end of the stick, according to AEMO’s calculations, with several solar farms provisionally sentenced to a drop of between six and eight points in their MLFs.
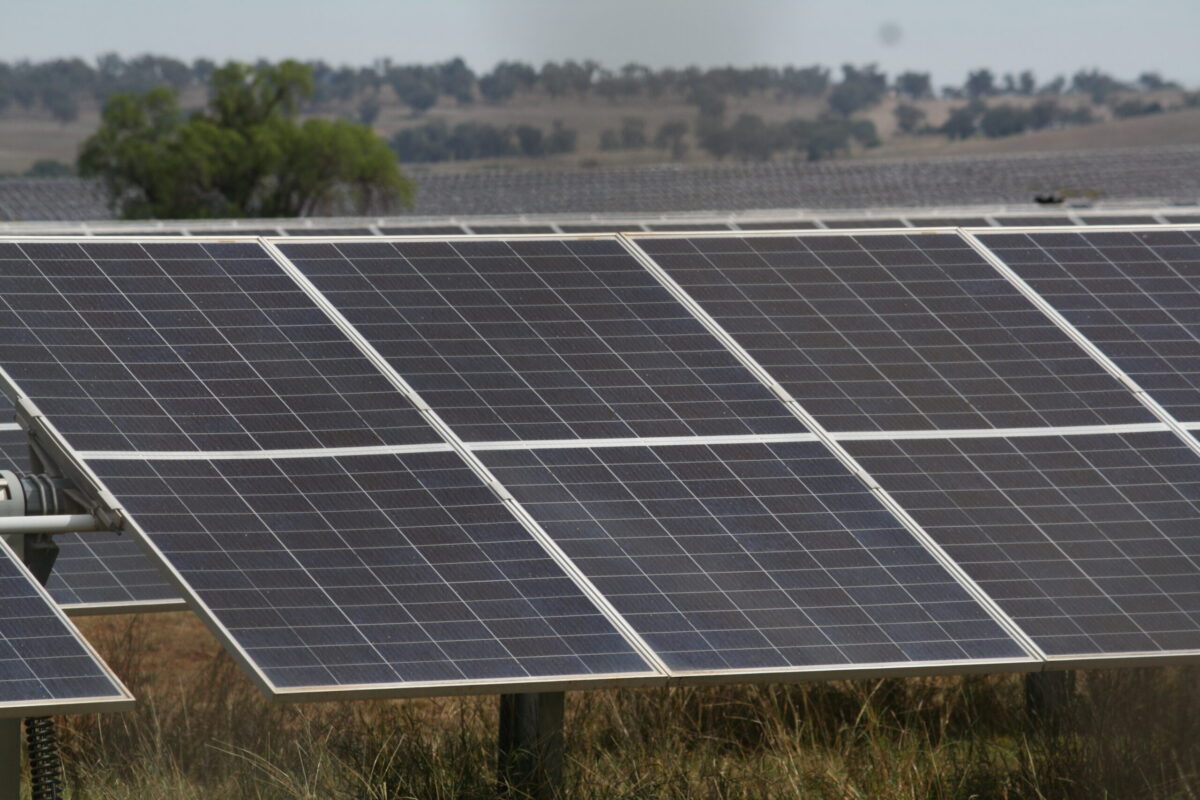
Spark Infrastructure’s 120 MW Bomen Solar Farm, for instance, goes from an MLF of 0.9417 to 0.8766; and the John Laing-owned 175 MW Finley Solar Farm takes another hit from 0.8800 to 0.8304.
The impact of MLFs leads to investor retreat
UK infrastructure investor John Laing provides an example of the havoc that unexpected drops in MLFs can cause to balance sheets.
After sustaining $128 million in losses on three of its renewable energy projects in the 2018-19 financial year, John Laing decided to freeze investment in standalone solar and wind farms, and put its Australian renewable assets up for sale.
On Thursday last week the company delayed its sale of Finley and the 200 MW Sunraysia Solar Farm (which fares slightly better in the draft 2021-22 MLFs, going from 0.7907 to 0.8038), after showing further losses in its full-year results for 2020. Losses from individual solar farms or even countries are not specified in the John Laing report, but the company cited one £10 million (AU$ 18 million) loss due to “further transmission issues in Australia”, as well as project performance losses of £89 million (AU$160 million) “particularly on solar assets in Australia and on the UK biomass assets”. In light of revised expectations, it will reorganise financing of the two large solar farms in preparation for sale in 2022.
In contrast to NSW solar farms, generators in Central Queensland, are set to bask in MLF increases of up to six points; and those in north-western Victoria, which have been through the wringer in recent times, are also winners in this draft document.
West Murray gets a boost from flows on the Murraylink
That is to say, the five so-called West Murray solar farms that had their output curtailed by half in September 2019 due to system strength issues in the region have enjoyed restored operations thanks to an inverter fix engineered by SMA in April last year, but have still been laboring under lower than expected returns due to MLFs. AEMO forecasts these will now bounce back from a low base by up to five points in the coming financial year.
The market operator’s draft document cites the “revision of intra regional limits” and “resulting changes in projected flows on Murraylink” interconnector, allowing more exports into South Australia, as the cause of the upward revision for renewable generators in the West Murray region.
All at sea with Marginal Loss Factors?
MLFs refer to the amount of energy from each generator that is expected to be lost during the transmission process, and accordingly weights what individual generators will be paid for energy exported to the grid. An MLF of 1 entitles a generator to 100% payment for its output. MLFs lower than one indicate a percentage reduction in the payment that generator will receive; for example, an MLF of 0.9 indicates that according to AEMO’s calculations 10% of energy exported will be lost in transmit, and the generator will be paid for only 90% of its output.
AEMO’S draft publication of proposed MLFs allows generators and other stakeholders to give feedback on their lot, given that the calculations, based on forecasts of intra regional generation, can have a substantial impact on revenues over the year ahead.
Submissions this year must be received by AEMO before 12 March in order to be considered in the preparation of the final report which will be published on 1 April.
What drives changes in MLFs?
“Year-on-year changes in MLFS are driven by projected changes in the NEM,” AEMO explains in this year’s draft document.
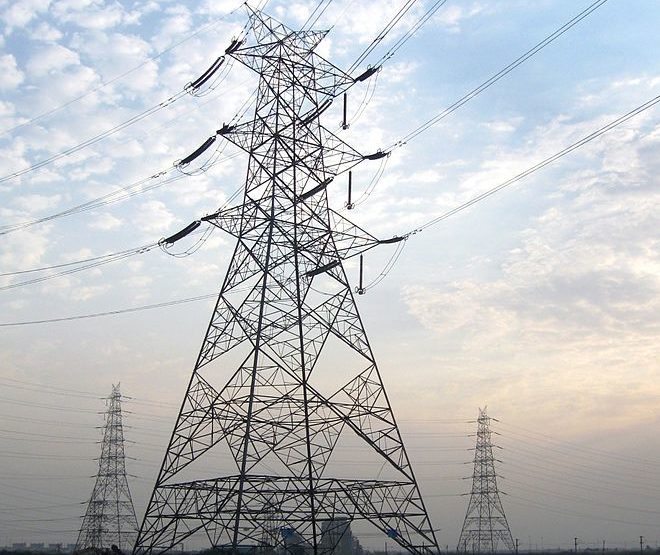
Augmentation, such as building new transmission lines, decreases impedance in the network, particularly in the area local to the augmentation; if impedance between the generator’s connection point and the Regional Reference Node (RRN) is decreased, the MLF assigned to that generator will move closer to 1 or slightly higher.
Changes to projected power flows in any area also influence allocated MLFs: if power flows increase due to increased generation or increased demand, likely congestion will cause MLFs to decrease; if projected power flow from a connection point to the RRN decreases, MLFs will improve, again rising towards 1.
Variations in MLFs for 2021-22 compared to previous settings are mostly due to changes in projected power flow over the network, says AEMO.
“The key drivers for these changes,” explains AEMO, “are additional generation capacity and generation that commenced operation within the 2020-21 FY being commercially operational for the entirety of 2021-22.”
Complexity rules
One region’s good fortune is often connected to another’s pain: for example, Northern Victoria’s MLFs for 2021-22 are higher than the current year, because of projected increased exports to New South Wales. Western Victoria’s MLFs, on the other hand, are lower, driven by increased imports over the Heywood Interconnector from South Australia.
In Queensland, MLFs in the south west have been driven lower by a large local increase in generation: the APA-developed 110 MW Darling Downs Solar Farm for example, which has a long-term offtake agreement with Origin Energy, is set to earn somewhat less in the coming year, with its MLF reduced from 0.9825 to 0.9766.
Northern and Central Queensland, however, will benefit from reduced overall generation leading to improved MLFs. In the north, for example, Edify Energy’s portfolio: Daydream (180 MW), Hamilton (69 MW), Hayman (60 MW) and Whitsunday (69 MW), which last year came under threat of curtailment to zero exports to the grid due to system strength issues, will, at least in the MLF stakes, all creep up towards 1 from variations on 0.8.
Calculations to arrive at MLFs are complex, and AEMO has consistently worked to improve transparency of its rationale, more frequently publishing updates and providing information on regional trends — the supply and demand landscape is continually changing.
True relief on MLFs won’t be felt until major transmission upgrades start to free up the system, starting in late 2021 with the Queensland-NSW transmission link, and major battery energy storage systems, such as Neoen’s Victorian Big Battery come on line to regulate release of energy into the network.
This content is protected by copyright and may not be reused. If you want to cooperate with us and would like to reuse some of our content, please contact: editors@pv-magazine.com.



1 comment
By submitting this form you agree to pv magazine using your data for the purposes of publishing your comment.
Your personal data will only be disclosed or otherwise transmitted to third parties for the purposes of spam filtering or if this is necessary for technical maintenance of the website. Any other transfer to third parties will not take place unless this is justified on the basis of applicable data protection regulations or if pv magazine is legally obliged to do so.
You may revoke this consent at any time with effect for the future, in which case your personal data will be deleted immediately. Otherwise, your data will be deleted if pv magazine has processed your request or the purpose of data storage is fulfilled.
Further information on data privacy can be found in our Data Protection Policy.