At the just-concluded 2021 United Nations Climate Change Conference better known as COP26 in Glasgow, Scotland, the consensus inevitably reached by global leaders to stay within the 1.5 degree warming target will have far-reaching impacts. For nations – such as Australia – that remain heavily dependent on fossil fuels, any meaningful action to achieve this goal would directly translate to an acceleration in our energy transition. Specifically, in the National Electricity Market (NEM), the path is quite clear – coal is exiting, and a significant number of new renewables and storage are needed to replace energy currently supplied by fossil fuels.
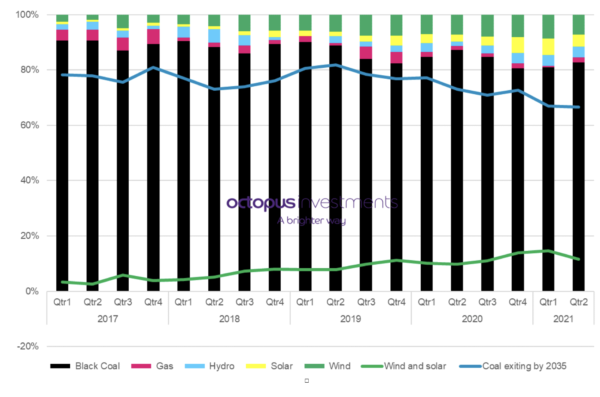
New South Wales (NSW), Australia’s largest energy market, clearly brings into focus the challenge and opportunity ahead for Australia. As shown in Figure 1, NSW’s predominant source of energy has been black coal (>80%), the vast majority of which (~70% of total generation) will retire by 2035. Moreover, given the difference in capacity factors between coal and renewable technologies (two to three times the capacity of coal is needed by renewables to generate the same amount of electricity), these trends present significant investment opportunities in Australia’s energy market. A level of investment which has not been seen at any other period in the market since these huge coal and gas power stations were built in the 70s. A similar story is also playing out in Queensland and Victoria with looming coal capacity exits.
Octopus Investments
From an energy market perspective, multiple factors will determine what mix of technologies will eventually replace these ageing coal assets. Replacing coal with renewables is not as straightforward as replacing capacity on a like-for-like basis, supplemental technologies that enable dispatchability and flexibility are crucial to controlling intermittency of renewables and ensuring consistent supply. Dispatchable assets are loosely defined as any generation technology that is not wind or solar, but that interacts with these generation technologies to ensure energy is “on call” regardless of weather patterns. The most important role dispatchable assets play (in a transitioning to energy grid) is the ability to fill any gap in supply when neither the sun is shining nor the wind blowing – that is, support reliability of the power grid during low renewable output.
For a long time, generation from gas has been touted as the ideal (dispatchable) alternative for when the shift away from coal begins. Energy markets around the world even went as far as rebranding gas as the “transition fuel” which would lead us to a zero-carbon future. However, examining the current evolution of the NEM, is gas the transitional fuel needed or are there other alternatives? How important is dispatchable supply to system reliability, and what does this mean for net-zero in the NEM by 2050?
In times like this, my buddy Timon here says: you got to put your behind in your past
Ten years ago, ask anyone in the NEM what generation assets they think would come in when coal left, and without a doubt, the answer would have been gas. Gas, as a power generation fuel has a very interesting history in Australia. In fact, for a very long time, the resource was cheap to extract, plentiful and buyers had access to cheap long-term contracts. However, in 2015, with the commencement of three Liquified Natural Gas (LNG) projects in Queensland, coupled with operations in Western and Northern Australia, Australia began its 5-year journey to becoming the largest LNG exporter in the world, with Qatar the only other country with export volumes of a similar scale. This linkage to international markets had major impacts on domestic gas users – including gas-powered generators (GPG) in the NEM – such as:
- New supply contracts were now significantly more expensive with 300% increases seen in some cases as domestic prices started tracking international LNG prices;
- Price discovery became more difficult in an already opaque market as contract lengths got shorter; and
- Leverage moved back to the supply-end of the market as the balance with demand got tighter;
Octopus Investments
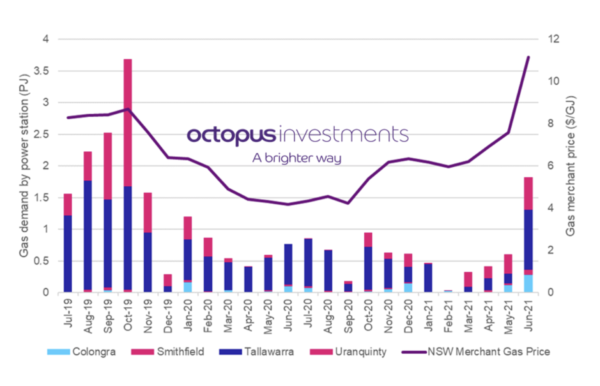
Remarkably, you might expect that the use of gas for electricity generation would move inversely to merchant gas prices, however that hasn’t been the case. As seen in Figure 2, looking at NSW, gas demand for gas-powered generators has shown no particular economic correlation to gas prices. Whilst the insignificance of the gas merchant market (most transactions settle under a pre-contracted price) is partly to blame, this has been largely been driven by events in the NEM.
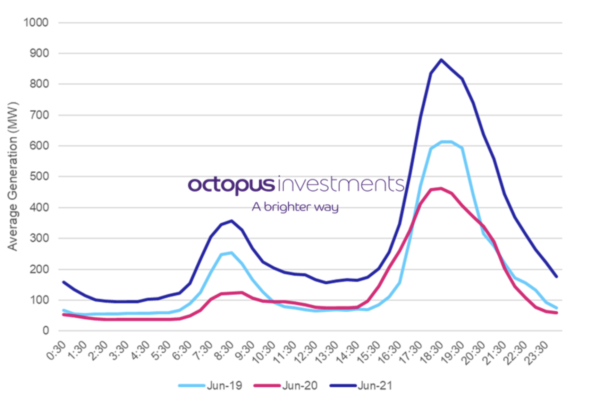
Supply availability – particularly coal, hydro, and renewables – is increasingly responsible for how much room there is in the electricity market for gas output especially as renewables continue to grow. In June 2021, gas-powered generator demand rose to its fourth highest month in two years with key outages to coal units accountable for most of this outcome. As seen in Figure 3 below, gas generation in NSW across the day last June was higher than the same period in previous years, with a visibly telling role in the morning and evening peak periods. However, in many months prior to June last financial year (as seen in Figure 2), the role of gas had been depleting in the state as renewables in addition to coal and hydro, continued to squeeze gas out of the supply mix. Perhaps the future role for gas in the electricity market is an opportunistic one?
Octopus Investments
Curiously, the major outages – such as the explosion at Callide Power Station in Queensland – happened in neighbouring states; underlining the importance of, and reliance on, imports to reliability in NSW. Given NSW itself is facing its own major energy gap as seen in Figure 1, is gas going to, after all be the transition fuel? Or is the transition itself signifying the need for another type of dispatchable capacity – one that brings with it the ability to take advantage of excess supply at other times of the day? Before exploring these questions any further – let’s look at imports, the critical role other states play in supporting energy reliability in NSW, and what these import trends mean for the future of dispatchable supply in NSW.
We are all connected in the great Circle of Life
Interconnection – the ability for states and regions to transfer power between themselves – is one aspect of the market that doesn’t get enough attention. However, the role it plays in supporting reliability is substantial especially as more coal exits the market. Looking specifically at NSW, it is important to highlight the role energy imports – enabled through interconnection with Queensland and Victoria – continue to play in the demand/supply balance in the state.
Octopus Investments
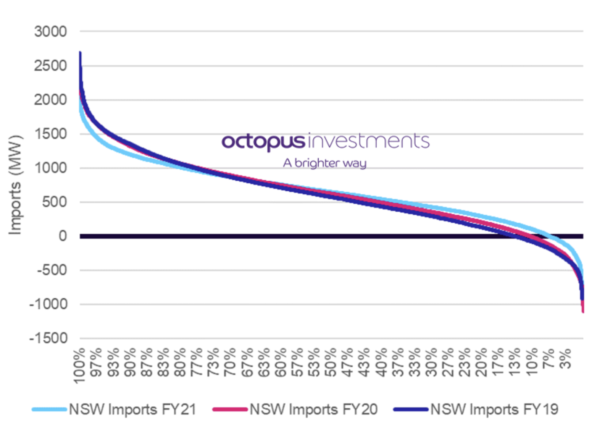
As seen in Figure 4 above, over the last three years NSW has been increasing its reliance on imports into the state (the higher the curve is above the zero line, the higher the imports into the state). In FY21, the state was a net importer of energy about 94% of the time, up from 90% in FY20, and 87% in FY19. In the last financial year, the state also imported over 1GW of energy about 21% of the time – highlighting the extent to which the state relies on neighbouring regions for cost-optimal supply and reliability. Is this a trend likely to continue as more coal retires? To answer this question, we examine what role imports from connecting states currently play during periods of demand/supply tightness in NSW.
Octopus Investments
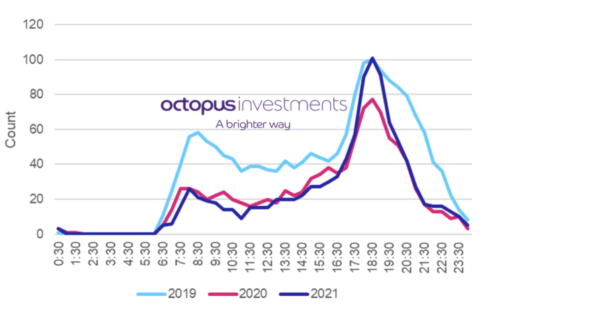
In Figure 5, we plot the number of periods – on a time-of-day basis – when NSW has imported over 1GW during periods when the power demand in the state has been greater than the 75th percentile for the year. The total number of these periods in FY21 is 1040 – equivalent to ~6% of all market settlement intervals in the year. At maximum demand during FY21, the state imported 1.6GW (up from 1.3GW in FY20) of energy from (predominantly) Victoria, and Queensland. Interestingly, looking at the middle of the day, NSW has halved the number of large imports on days with high demand since FY19. This is largely due to the growth in renewable supply – particularly solar (rooftop and grid) – in the state. However, the large imports during tight periods in the evening peak have remained strong, in fact, an argument can be made that this is a growing trend. As coal retirements strip NSW of local dispatchable supply in the coming years, more constraints on the interconnectors should be expected during these tight periods. As import limits are reached, other generation resources within NSW would then have to fill this demand/supply gap. However, looking at the growing intra-day spread over the years between when these critical imports are needed, a case can be made for energy storage as the ideal dispatchable technology for filling this energy gap to be left by coal. As seen in Figure 5, in FY21, NSW imported over 1GW of power during tight periods five times more often in the evening peak than it did during the day; however, in FY19, this number was only 2.5. This growing spread in market tightness through the day is a key driver of price arbitrage that energy storage technologies – such as batteries and pumped storage – need to be profitable.
However, it is worth mentioning that from FY25, a new 800MW interconnector linking NSW to South Australia – Project Energy Connect – is expected to be operational. The extent to which this interconnector would support reliability in NSW during these peak demand periods is one to watch.
A king’s time as ruler rises and falls like the sun
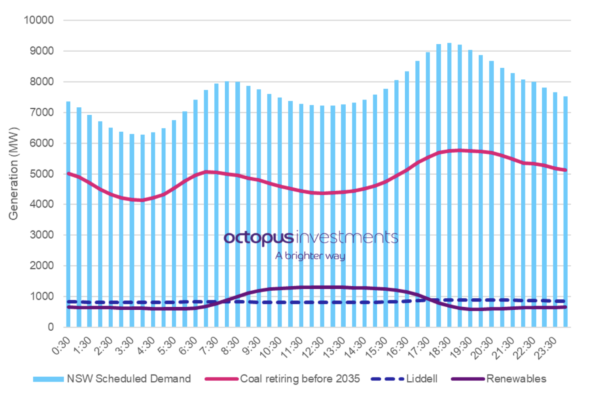
Liddell Power Station – a coal-powered thermal generator – located in NSW is the next coal fleet in line for retirement as it reaches the end of its 50-year technical life. With the first unit of Liddell power station scheduled to retire in April 2022, and the remaining three units scheduled to close a year later in April 2023, what impact will the station’s exit will have on intra-day demand/supply balance in the state? As seen in Figure 6, Liddell currently contributes between 10-11% of the entire demand in NSW through the typical day. In other words, NSW would have to replace 10-11% of its current supply source in the next two years.
Octopus Investments
The key to understanding the impact of this exit, however, is in comparing the supply from Liddell with the supply from renewable technologies (wind and solar) in the state. On average, whilst Liddell supplies 30% less than renewables during the day, this situation is reversed in the evenings – when solar is out of the market – with the power station’s output up to 50% higher than the entire renewable generation (wind) in the evening peak. Consequently, it is safe to assume that whatever the price impact from the exit of this power station will be during the day, that impact is expected to be much more pronounced in the evenings – especially during the peak period. From a market planning and investment perspective, this retirement is likely to further drive the spread between peak and off-peak periods – creating even stronger arbitrage signals for energy storage technologies.
Looking beyond Liddell and 2022, the case remains strong for dispatchable storage in NSW well into the future. As seen in Figure 6, the coal fleet scheduled for retirement before 2035 currently supply ~70% of the state’s demand through the typical day. Therefore, as more renewable technologies connect as replacements, the need for energy shifting through storage would get even stronger. In addition, the state government’s roadmap looking to attract $32 billion worth of investments in ~12GW of new renewable energy capacity by 2030 is also likely to accelerate the need for storage in the state.
Why won’t he be the king I know he is, the king I see inside?
To date, there has been no grid-connected battery in NSW with only a handful of batteries operating in the rest of the NEM (Victoria and South Australia). This is partly due to the financing mechanism currently used for these assets with most of their bankable revenues driven by subsidies, government and network contracts, as well as grants. As for the operating battery assets in other regions, the ancillary services markets (frequency control and balancing) have also provided a majority of the revenues (70-80%) for the uncontracted capacity in these assets; with energy arbitrage providing about 20%. Whilst this financing mechanism has been acceptable so far, the question of whether these bankability measures remain ideal going forward is one worth asking. With most retail contracts for firming also in the two to four year window (aligned with customer offer periods), investors and the lending community would need to look for innovative ways to bring this technology to market given the role they are poised to play in the very immediate future, as well as the growing market case for this technology. The other piece of the puzzle is the cost of batteries – however these costs are falling fast, and it is only a matter of time before the learning rates seen in wind and solar projects globally become a mainstay in the battery market.
On the policy side, a new rule change to create a single participant category for hybrid technologies (solar/wind plus storage) will go a long way in clearing up some of the regulatory barriers slowing down the deployment of capital into batteries at scale in the NEM. However, given batteries have the ability to act as load (when charging), the rule maker – the Australian Energy Market Commission (AEMC) – in its draft rule has not exempted battery assets from paying the transmission use of system charges (TUOS). TUOS, is a regulated charge paid by all end-users (customer/load) of the network as a way for transmission network operators to recoup investments made in their networks. However, given batteries only store power to discharge at a later time, a charge such as TUOS levied on batteries increases the weighted average cost of capital (WACC) for investors and puts the technology at a disadvantage to other dispatchable technologies such as gas who do not pay this levy. In fact, given the cycling losses batteries currently have to manage between their charge and discharge cycles, an argument can be made that the technology is already at a natural disadvantage to other dispatchable technologies, and an extra punitive charge may only serve to slow down their uptake at a time when they are most needed.
Octopus Investments
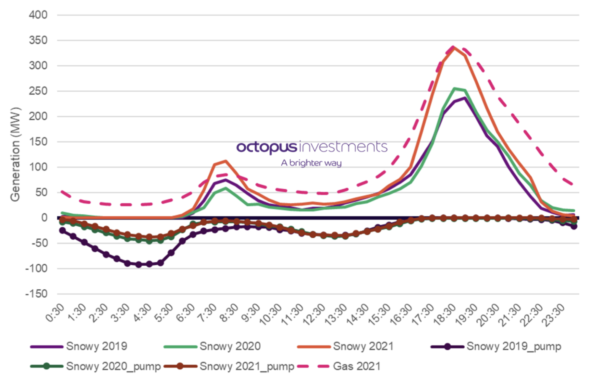
Going forward, unlike gas whose role looks to be continually reducing and increasingly opportunistic (see Figure 2 and Figure 3) as the market transitions, storage technologies look to be increasing their presence in the market. As seen in Figure 7, the pumped storage unit run by Snowy in NSW is increasingly dispatching more energy in the peak periods whilst it takes advantage of overnight wind and midday solar to pump. This is a great example of the role storage assets will play in a future decarbonised NEM. As more renewable technologies connect, this market balancing between load (pumping) and generation (discharge) will be critical to not only reliability, but also grid security. For what it’s worth, as shown in Figure7, Snowy’s pumped hydro storage alone, on average, delivered about the same energy during the evening peak period in FY21 as the entire gas fleet in NSW; a staggering outcome, and perhaps a sign of things to come.
About the author
Lumi Adisa works as an Investment Director – Energy Markets at Octopus Investments Australia. He has over a decade of experience in modelling and analysis of energy markets and was a key member of the modelling team that built the inaugural Integrated System Plan (ISP) models at the Australian Energy Market Operator (AEMO). Prior to joining Octopus, Lumi worked as the Head of Energy Market Analytics for a global consulting firm in energy markets where he advised energy market bodies, governments, and investors on energy policy, modelling and design. Lumi holds a PhD in applied mathematics from the University of Adelaide with the core of his thesis focusing on modelling energy storage using nanotechnology.
At Octopus, Lumi is responsible for implementing Octopus Australia’s portfolio strategy which will play an influential role in Australia’s energy transition over the next several years. Octopus Group is one of the largest owners of renewable energy projects in Australia and Europe, it owns some 260 assets, on behalf of wholesale and institutional investors. Domestically, Octopus Australia is responsible for managing over $1 billion, across construction and operational assets.
The views and opinions expressed in this article are the author’s own, and do not necessarily reflect those held by pv magazine.
This content is protected by copyright and may not be reused. If you want to cooperate with us and would like to reuse some of our content, please contact: editors@pv-magazine.com.


By submitting this form you agree to pv magazine using your data for the purposes of publishing your comment.
Your personal data will only be disclosed or otherwise transmitted to third parties for the purposes of spam filtering or if this is necessary for technical maintenance of the website. Any other transfer to third parties will not take place unless this is justified on the basis of applicable data protection regulations or if pv magazine is legally obliged to do so.
You may revoke this consent at any time with effect for the future, in which case your personal data will be deleted immediately. Otherwise, your data will be deleted if pv magazine has processed your request or the purpose of data storage is fulfilled.
Further information on data privacy can be found in our Data Protection Policy.