Setting the Macro Scene
Generally speaking, over this past decade we have seen a term of unconventional global expansionary monetary policy, with central banks increasing their money supply and buying a “predetermined” amount of federal/state debt (quantitative easing), coupled with making key interest rate cuts (loosening monetary policy). These actions were taken to create an environment of historically low interest rates for individuals and businesses to access cheap capital to help stimulate the economy.
Low inflation rates can be a sign of slow economic growth – banks want to sustainably stimulate the economy and they can do so by lowering interest rates (making it cheaper to borrow). One reason why interest rates have been continuously cut is likely due to inflation rates remaining below various central banks’ target inflation rates despite the ongoing interest rate cuts.
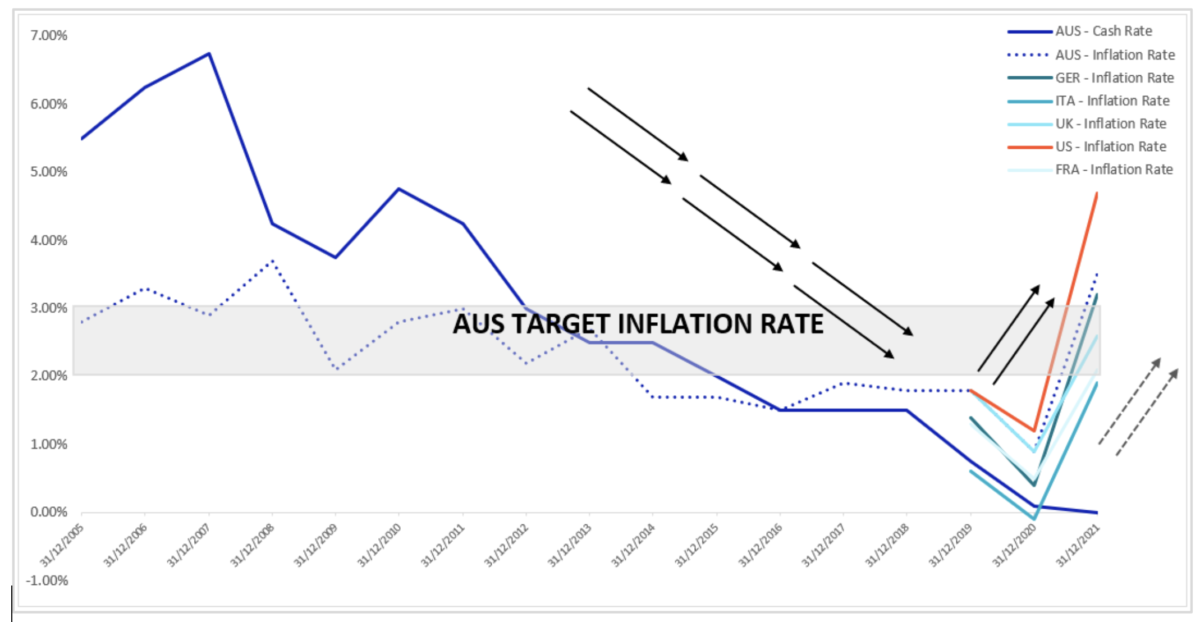
The Royal Bank of Australia (RBA) has a medium-term target inflation rate of 2-3% and the last time Australia’s inflation rate fell within this target was 2013 – a rate of 2.7% (All Groups). For comparison both the FED / ECB have a long-run inflation target of 2%. The premise for a target rate is the provision of a framework for central banks to make policy decisions to help stimulate sustainable economic growth through price stability, a larger labour force, healthy consumer demand and generally a better quality of life.
RBA
Figure 1 above illustrates the directional flow of both inflation and interest rates for Australia over the last ten to 15 years, including inflation rates for other various G20 countries over the last three years. Without charting all data points for each country back to 2005 it’s fair to say that most countries experienced a similar overall direction for inflation and interest rates. Figure 1 shows that, at least for the time being, all countries have experienced a rise in their downtrend for inflation between 2020-21 (Australia at Dec-20 was 0.9% and Dec-21 was 3.5% – All Groups), likely due to the low interest rate environment (creating consumer demand) being further exacerbated by the global supply-chain constraints caused by Covid-19 pandemic driving the prices of goods and services higher.
Despite this rise in inflation, central banks held interest rates in Q1 2022, and specifically the RBA recently held the cash rate at 0.1% on 2nd March. A rising inflation rate environment isn’t necessarily good or bad, it’s the speed at which inflation rises or falls (stability) and the timeframe for which high or low inflation rates are sustained, that can be generally problematic.
Inflation is a lagging indicator, therefore the rates seen in Figure 1 manifest actions from December 2020-21 and don’t reveal what has occurred in the wider economy during Q1 2022 – which by all accounts, has been rather significant. Supply-chain constraints have continued to be an issue for many industries this year – finding freight space is becoming increasingly challenging. This has driven up the cost of goods and services, and given the amount of cheap capital that has been made available through the pandemic and increased consumer demand, these supply chain challenges have now been further exacerbated.
Moreover, recent actions by Russia in Ukraine have put significant stress on the supply of global natural resources, largely across the EU, which in turn has caused the price of several commodities to skyrocket as people scramble to recalibrate their logistics. Naturally, over time, these events will flow through to underlying consumers via higher fuel costs (already being seen), higher wholesale energy prices and generally a higher cost of living, also known as supply-side inflation.
Central banks – most of whom were already in the midst of rising inflation rates – are now faced with the above issues, underlying the scale of the challenges ahead. An option for central banks in this situation could be to raise interest rates (increasing the cost of borrowing) however, a key concern with choosing this option is the knock-on impact it could have on the economy.
Without doubt central banks also want to see and retain higher levels of consumption coming off the back of the pandemic and raising interest rates would likely dampen this. It is left to be seen how impactful the events from the Russia-Ukraine conflict will be globally and if inflation continues to rise because of it, governments might find their hands tied and that they would need to raise interest rates to try to decelerate inflation.
Whilst central banks have been hinting at rate hikes this year, this was pre-Russia-Ukraine; the key question then becomes: at what economic price will these rate hikes come, if indeed they do raise them at all? Time will tell.
How are energy markets tied to inflation?
Inflation is typically measured by the Consumer Price Index (“CPI”) – the price for a weighted average basket of goods and services which households buy. The groupings for each basket of goods for Australia (and to a large extent globally) is reflected below in Table-1.
Table-1: CPI, Australia, weighted average of eight capital cities
|
Grouping |
Quarterly CPI (Sep-21 to Dec-21) |
Annual CPI (Dec-20 to Dec-21) |
|
% change |
% change |
|
|
All groups CPI |
1.3 |
3.5 |
|
Food and non-alcoholic beverages |
0.7 |
1.9 |
|
Alcohol and tobacco |
0.9 |
1.1 |
|
Clothing and footwear |
2.6 |
-0.3 |
|
Housing |
1.8 |
4.0 |
|
Furnishings, household equipment and services |
1.1 |
3.6 |
|
Health |
-0.3 |
3.3 |
|
Transport |
2.8 |
12.5 |
|
Communication |
0.1 |
-0.5 |
|
Recreation and culture |
1.5 |
2.1 |
|
Education |
0.1 |
0.6 |
|
Insurance and financial services |
1.2 |
2.2 |
There are many variables that impact inflation and energy is one of the key drivers. For Australia, energy is captured within the transport grouping. As seen from Table 1, transport has risen significantly between Dec-21 and Dec-22 (+12.5%), and it is evident the impact it can have on headline CPI figures vs other groupings. Transport is heavily influenced by the price of fuels, specifically oil and gas, therefore it is important to understand the price movements of these commodities both domestically and globally given their volatility and the impact they have on households and businesses via higher fuel prices and wholesale energy prices.
For December-21, fuel prices in Australia rose 6.6% year-on-year due to increased demand for oil/gas as Covid-19 restrictions eased and supply for oil remained limited and, as alluded to above, this has been intensified by Russia’s actions on Ukraine, further hampering supplies with crude oil reaching $US118 a barrel at the time of writing; this is a ~150% increase on the price of crude oil from just 12 months ago.
Australia meets its demand for fuel by importing refined oil and these higher international prices are starting to filter through domestically with fuel prices already up ~10%. It is therefore a fair assumption that the price of energy, in all forms, is a main driver behind global inflation.
How has Russia’s invasion of the Ukraine impacted energy markets?
Geopolitical tensions commonly involve the topic of energy; it can be interpreted as a sign of strength or weakness (reliance on supply) for countries and can also be used as leverage. The timing of Russia’s movements into the Ukraine has brought this role of energy in conflicts to the fore, especially given the wider macroenvironment. In addition, the current developments have also illustrated the over-reliance of the EU on Russia for energy supplies. This would be less of an issue if the EU had a more diverse supply chain, and also if they increased their investment into clean energy and storage.
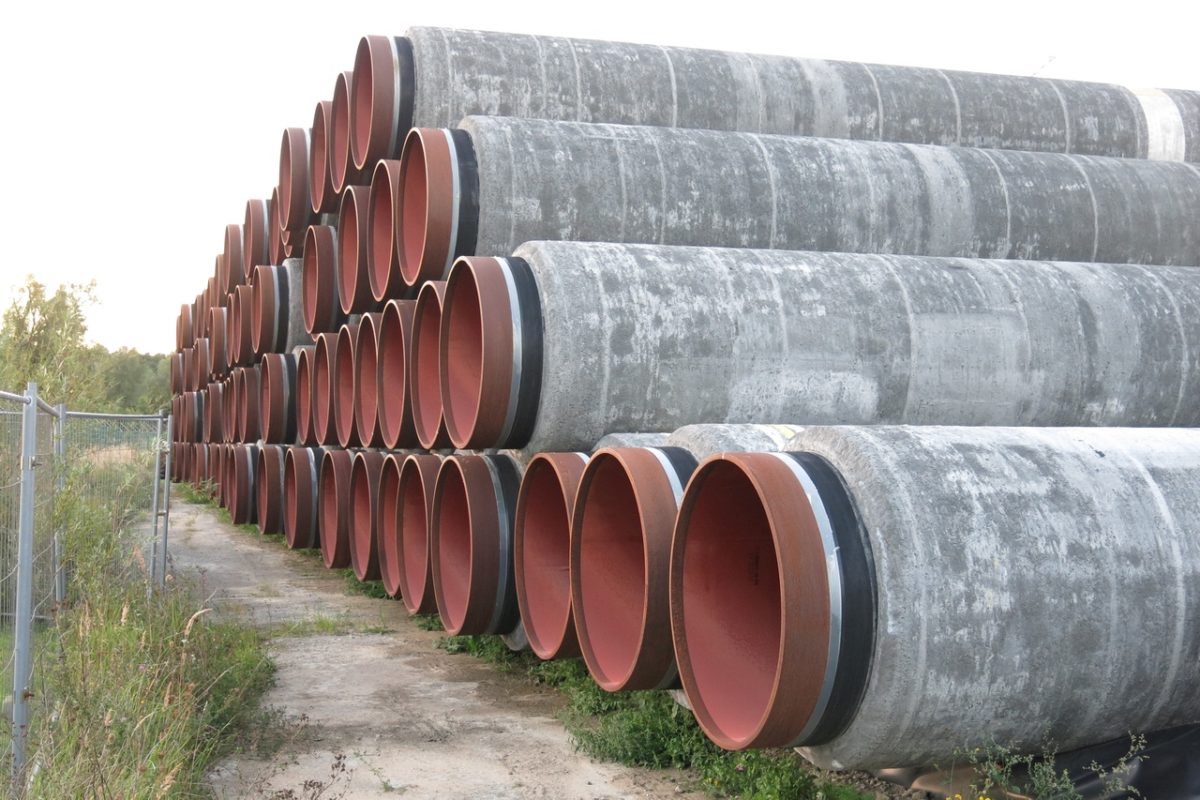
Russia are a large producer of crude oil, coal and gas, accounting for ~30-40% of EU’s gas supply and a large proportion of global gas supply (~18%). In response to Russia’s actions on Ukraine, various economic sanctions have been imposed on Russia, including significant sanctions on energy supplies from Russia with the most notable being; (A) On 22nd February Germany halted the Nord Stream 2 Baltic Sea gas pipeline project, designed to double the flow of Russian gas direct to Germany and ease the pressure on EU consumers facing record energy prices following the Covid-19 pandemic; (B) The US imposed specific sanctions on Gazprom, the owner of Nord Stream 2, indicating the wind down of various financial transactions with them in the US credit market, and more recently; (C) President Biden announced a ban on Russian oil, natural gas and coal imports into the US, also warning it could lead to an increase in US gas prices.
Unsurprisingly, the sanctions haven driven supply shock causing the price of various non-Russian commodities to become significantly more expensive over the last few weeks, with the benchmark for European gas, Dutch TTF, rising +30% week-on-week from 22nd February and a further +106% week-on-week from 28th February, and Newcastle coal futures also rose +67% week-on-week from 28th February. Higher gas and coal prices will be felt in many energy markets through increased wholesale energy prices as generators bid (at least) at their Short Run Marginal Cost (“SRMC”), a development already present across the EU.
The decisions to implement these sanctions was made despite the current macroeconomic risk surrounding inflation and the impact of high energy prices on inflation. On the one hand, by halting Nord Stream 2 there is a risk of increasing energy prices further by reducing access to gas supply and thus increasing the risk of already rising inflation. However, on the other hand, proceeding with Nord Stream 2 could further increase EU’s dependence on Russian gas and thus gives Russia the opportunity to use this as a geopolitical leverage in the future. The EU and its allies want to apply as much pressure on to Russia without starting an energy crunch which in turn could hurt both their economy and the global economy.
What does this mean for the Australian energy market, in particular the National Electricity Market (“NEM”)?
There is an argument that wholesale energy prices in Australia have been somewhat protected against global gas price volatility, particularly the gas supply-chain shortage issues experienced in the EU during late 2021. This is largely due to Australia being one of the world’s largest natural gas exporters, exclusively ~80% exporting natural gas as LNG via long-term contracts. ~20% of LNG exports are sold on the spot LNG market, strengthening the link between the domestic market and international commodity price movements.
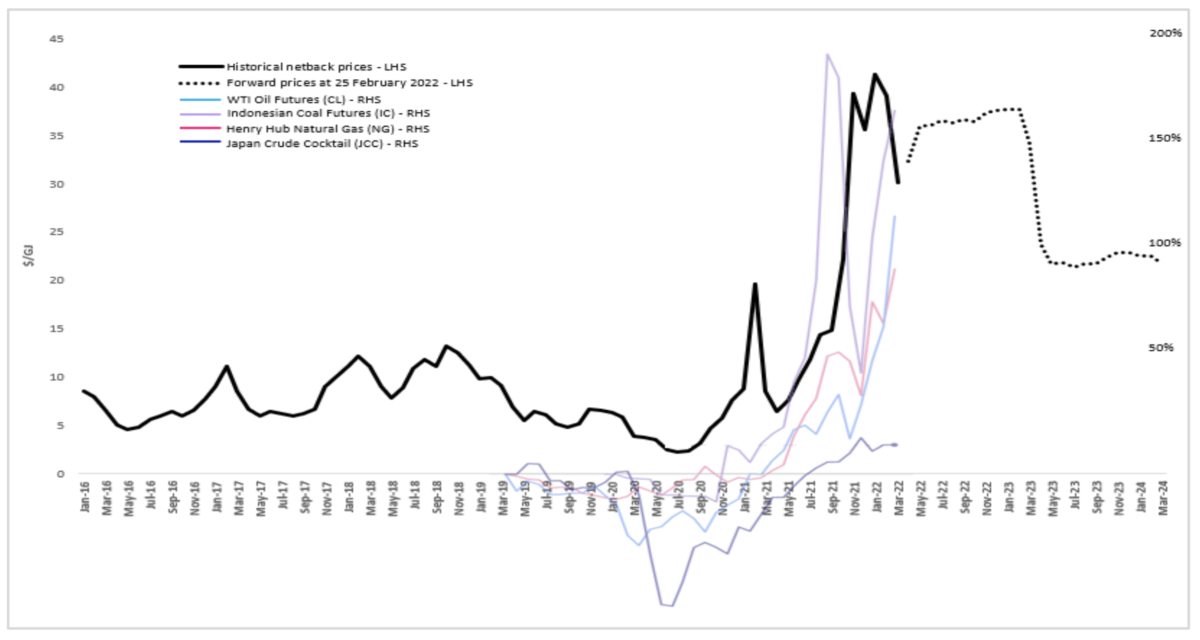
Shorter term domestic gas prices assume an export driven domestic gas price directly linked to Asian LNG prices netted back to Wallumbilla (the “LNG Netback Price”), that is to say, “it is calculated by taking the price that could be received for LNG and subtracting or ‘netting back’ the costs incurred by the supplier to convert the gas to LNG and ship it to the destination port” (ACCC, 2022).
ACCC
Whilst there may be some insulation to short-term volatility, there exists a fair amount of correlation between domestic gas prices and international gas prices, as well as global commodity price trends. Figure 2 above illustrates the correlation between the LNG Netback Pricing – LHS (as of 25th February) and key fuel commodity price futures (% increases) – RHS, which have seen a significant rally since April-2020.
It is worth noting that the LNG Netback prices in Figure 2 do not reflect any increase in Asian LNG Netback Prices since 25th February, which will likely see a further rise given the bullish trend in commodity prices since then (e.g., West Texas Intermediate (WTI) Oil closed at ~$US91 on 25th Feb and currently sits at ~$US118 at the time of writing). In addition, given the link between international oil prices and Asian LNG prices (up to 25% correlation), it is expected that this increase in crude prices will soon flow through to LNG prices.
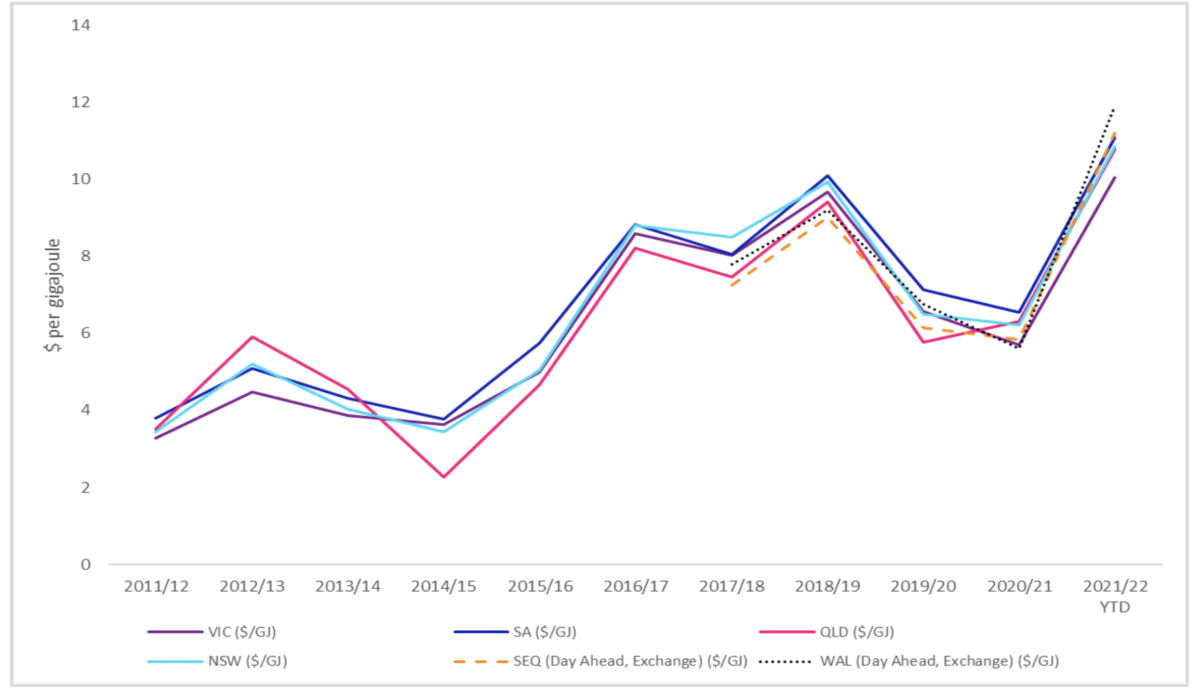
Figure 3 below also shows that the same correlation exists in the direct domestic gas market. Currently trading at ~$11.9/GJ you could also argue that domestic gas prices have increased quite significantly; ~+52.8% over the last five years and ~+112.5% this last year, and this does not account for recent macroeconomic events. Perhaps Australia isn’t as shielded as thought?
AER
Biden’s recent announcement of shutting off Russian oil, gas and coal imports to the US will no doubt also have global ramifications. Indeed, the US have reserves to rely on, however, EU and Asian countries will scramble to enter new long-term contracts with alternatives which, whilst very challenging, could result in Australia being pulled in to help its allies (via new long-term contracts or swap contracts). Exported LNG would be sold at a higher cost base on the pulled demand from the EU and Asia, in turn leading to higher domestic wholesale energy prices. Another argument for more investment into renewables, but also a concern for the central banks, as this could further increase inflation especially in the current environment.
Wholesale energy prices are typically set by the short-run marginal cost (“SRMC”) of the generation technology used to meet demand (marginal pricing basis). Within the NEM, this means the least expensive energy is first sourced to satisfy demand and is dispatched in that order until the last megawatt hour (MWh) of demand is met; with the unit supplying that last MWh determining the settlement price ($/MWh). This is typically coal, gas or hydro, depending on the level of demand, with gas being the main source of flexibility and usually setting the price during periods of high demand.
Renewables, particularly solar and wind, have a zero marginal cost of production (the sun and wind are free) and therefore they will always be dispatched ahead of other marginal price setters such as coal and gas. For coal and gas, as the price of the underlying commodity rises their SRMC rises, which feeds through to higher price bids in each settlement period, creating higher overall wholesale energy prices. Gas is seen as the “transition fuel” and as more coal plants are retired and replaced by renewables it will more frequently become the price setter in the market during peak periods. This of course depends on the role of large-scale batteries and the extent to which they could replace gas at a lower cost.
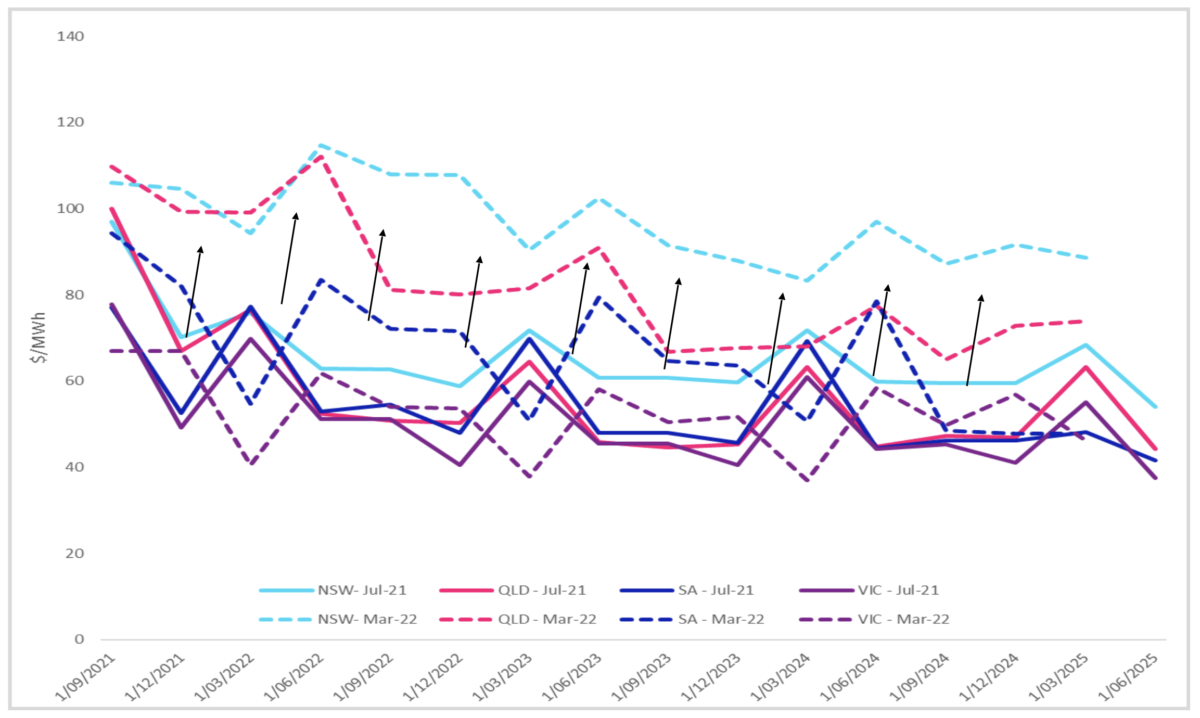
Over the last 12 months or so we have witnessed Australian Stock Exchange (ASX) electricity future prices trending upwards, and I have illustrated this below in Figure 4; prices are ~49% higher in NSW, ~57% in QLD, ~25% in SA and ~7% in VIC, which within a short timeframe is quite significant and is ultimately felt by customers. The main drivers for these movements will largely relate to supply-side issues (Callide B), flooding events and general sentiment in the market. When you combine these domestic factors with on-going events in Ukraine, causing commodity suppliers to recontract or enter new contracts as they redirect demand from Russia to other sources, it is likely we will see a further increase in wholesale energy prices.
ASX
Based on the current merit order of supply for all countries, the ongoings in the EU and the impact it is having on underlying commodity prices, these developments are hugely important for not just Australia, but global energy markets. However, would this be an issue if countries were 100% renewable given nobody can switch off the sun or the wind?
Can clean energy and renewables help solve this?
The rollout of renewables should be driven primarily by (i) shortfalls in supply, as seen in the EU due to over-reliance on Russia – a significant issue of national security, and (ii) rising energy price expectations as baseload (coal and gas) retires. Renewables are the lowest cost and quickest form of new generation capacity, and they’re clean. Overtime, as more renewables are deployed, energy markets will be less focused on marginal costs of production and more focused on the marginal cost of flexibility – i.e., what technology, old and new, can guarantee availability to meet the last MWh of demand, especially in an energy system with more intermittent renewables. The mix of these flexible technologies driving price being (i) batteries – short-term storage, (ii) pumped hydro – longer duration storage, and (iii) natural gas – today’s main source of flexibility.
Based on current market dynamics, the price and dependence of supply on coal, oil, and gas are so important to understand, not just from an energy markets standpoint but also for the impact they can have on wider economies. These commodities are not merely core assumptions that impact the balance between supply and demand for energy, and therefore impact wholesale energy prices (which we now know is a key driver for inflation), but these past few weeks have also illustrated how these natural resources play a major role in geopolitics.
In fact, they are key considerations for international security; a point which would be mooted if countries were 100% renewable. Despite the outcome of COP26, Russia’s recent actions could be an accelerator for countries to bring forward their net-zero commitments and invest even more into renewables, as they look to diversify their sticky energy supply mix, pivot away from their reliance on fossil fuels and dependence on certain countries to supply them and remove themselves from national security matters tied-in with energy.
Furthermore, there is no denying that an energy system working in perfect harmony with 100% renewables would supply lower costing and greener energy to consumers vs the energy markets we see today, which are still heavily reliant on fossil-fuels. The delta in the falling levelised cost of electricity (“LCoE” = the cost competitiveness of an electricity-generating asset) between renewables vs their fossil-fuel counterparts is a clear reflection of this, as higher commodity prices (coal and gas) translate to a stronger investment incentive in clean energy (assuming a flat LCoE for wind and solar).
The issue is not if these net-zero targets will be achieved, but as it is for most countries, it is how bumpy will the road be in achieving this target. More importantly, how can this be delivered efficiently and in a timely manner given the increasing links and interdependencies of national and energy security especially during times of conflict?
–
Figure 1 data source: RBA – Cash Rate Target | RBA, Inflation Target | RBA, G20 – CPI All items (oecd.org)
Table 1 data source: Consumer Price Index, Australia, December 2021 | Australian Bureau of Statistics (abs.gov.au)
Figure 2 data source: LNG netback price series | ACCC, WTI current-month contract, Indonesian Coal current-month contract, Henry Hub Natural Gas current-month contract, Japan Crude Cocktail current-month contract
Figure 3 data source: AER – Gas market prices | Australian Energy Regulator (aer.gov.au)
–
Author: Mike Jeffries, Octopus Investments Australia
The views and opinions expressed in this article are the author’s own, and do not necessarily reflect those held by pv magazine.
This content is protected by copyright and may not be reused. If you want to cooperate with us and would like to reuse some of our content, please contact: editors@pv-magazine.com.






2 comments
By submitting this form you agree to pv magazine using your data for the purposes of publishing your comment.
Your personal data will only be disclosed or otherwise transmitted to third parties for the purposes of spam filtering or if this is necessary for technical maintenance of the website. Any other transfer to third parties will not take place unless this is justified on the basis of applicable data protection regulations or if pv magazine is legally obliged to do so.
You may revoke this consent at any time with effect for the future, in which case your personal data will be deleted immediately. Otherwise, your data will be deleted if pv magazine has processed your request or the purpose of data storage is fulfilled.
Further information on data privacy can be found in our Data Protection Policy.