From pv magazine global
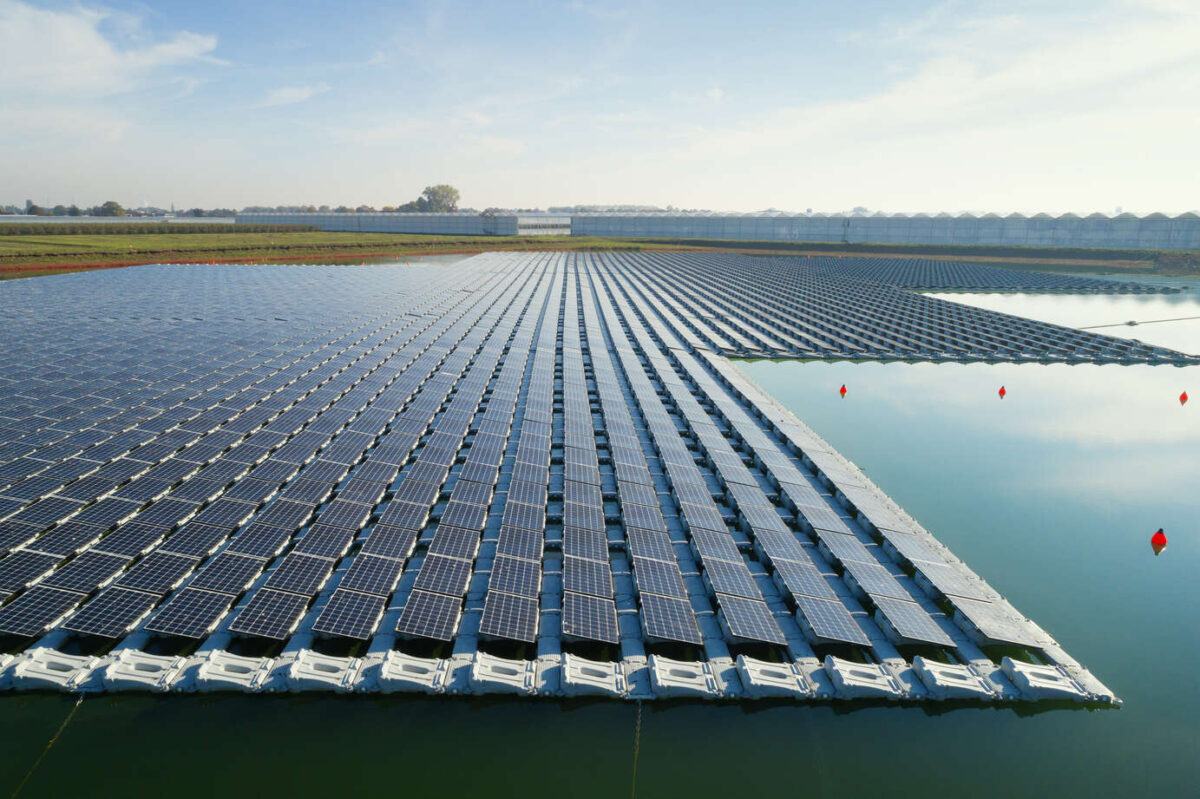
Researchers from China, Thailand, Sweden, and the United States have used a PV system performance model from Sandia National Laboratories to calculate the potential for floating solar (FPV) generation across the world, with specific results for the 20 countries with the highest potential.
The study only considers global reservoirs larger than 0.01 km2, with 30% of their area covered but not exceeding 30 km2. The academics used three global databases to filter the eligible reservoirs, Global Reservoir and Dam (GRanD), the Georeferenced Global Dam and Reservoir (GeoDAR), and OpenStreetMap (OSM). There are a total of 114,555 reservoirs worldwide meeting the criteria with a total area of 554,111 km2. Of those, 2,561 reservoirs already have hydraulic power generation and grid infrastructure in place.
“Unlike previous studies that use empirical formulas to estimate the FPV electricity generation potential, we use a technically rigorous PV system performance (PV_LIB, Sandia National Laboratories) that considers climate conditions and the specifications of the particular PV and inverter used,” the scientists said.
The solar panel is Panasonic’s VBHN235SA06B, with an output of 235 W and 18.6% efficiency. The 240 V inverter is also from the Japanese manufacturer. The team used data for solar radiation, temperature, and wind speed spanning from 2001 to 2020, from the Synoptic 1 degree (SYN1deg) and ECMWF Reanalysis version 5 – Land (ERA5-Land) databases.
The results showed that the mean annual electricity generation potential from FPV built on global reservoirs is 9,434 TWh, with a standard deviation of 29 TWh. Covering 30% of reservoirs with floating solar could also reduce annual water evaporation by 106 km3. If the reservoir area coverage is reduced to 20% or 10%, the FPV annual generation would be 7,113 TWh or 4,356 TWh, respectively.
“Globally, the highest regional potential tends to be concentrated in parts of the United States, eastern Brazil, Portugal, Spain, northern South Africa, Zimbabwe, India, and eastern China,” the scientists said.
The results also show that 40 countries have higher FPV potential than current annual electricity demand, with Brazil’s enormous 538 TWh per year of electricity demand being fully met by potential FPV generation of 865 TWh per year. Zimbabwe, Laos, Ethiopia, Cameroon, Myanmar, and Sudan have considerably higher FPV electricity potential than current demand, according to the study.
The results for the top 20 countries for floating solar potential are as follows:
- United States: 1,911 TWh per year
- China: 1,107 TWh per year
- Brazil: 865 TWh per year
- India: 766 TWh per year
- Canada: 506 TWh per year
- Russia: 236 TWh per year
- Mexico: 228 TWh per year
- Australia: 210 TWh per year
- Turkey: 171 TWh per year
- South Africa: 144 TWh per year
- Thailand: 134 TWh per year
- Spain: 132 TWh per year
- Argentina: 117 TWh per year
- Vietnam: 108 TWh per year
- Nigeria: 93 TWh per year
- Iran: 85 TWh per year
- Zimbabwe: 84 TWh per year
- Sri Lanka: 80 TWh per year
- Sweden: 80 TWh per year
- Venezuela: 80 TWh per year
“Achieving this vision will require addressing lingering problems related to policy, planning, financing, regulation, technological support, and construction/maintenance,” said the scientists.
They shared their findings in “Energy production and water savings from floating solar photovoltaics on global reservoirs,” which was recently published in Nature Sustainability.
This content is protected by copyright and may not be reused. If you want to cooperate with us and would like to reuse some of our content, please contact: editors@pv-magazine.com.


27 comments
By submitting this form you agree to pv magazine using your data for the purposes of publishing your comment.
Your personal data will only be disclosed or otherwise transmitted to third parties for the purposes of spam filtering or if this is necessary for technical maintenance of the website. Any other transfer to third parties will not take place unless this is justified on the basis of applicable data protection regulations or if pv magazine is legally obliged to do so.
You may revoke this consent at any time with effect for the future, in which case your personal data will be deleted immediately. Otherwise, your data will be deleted if pv magazine has processed your request or the purpose of data storage is fulfilled.
Further information on data privacy can be found in our Data Protection Policy.