The latest data from Australian solar and storage market analyst SunWiz shows national rooftop market volumes in June wound back by 14% compared to May, falling back in line with a market decline that started in February.
A total of 248 MW of new capacity was installed in June, well down on the 288 MW that was deployed in May, the fourth largest month on record for the small-scale technology certificate (STC) market. The June total is above the volumes seen in the same month in the past two years but below that observed in 2021.
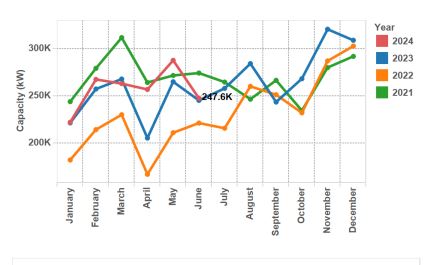
Image: SunWiz
Despite the drop off, the year-to-date total is tracking at 6% above last year but SunWiz Managing Director Warwick Johnston said the figures are covering up a worrying trend.
“The market capacity looks good, but what it’s hiding is that it’s trending backwards,” he said. “It’s a declining market. Volumes are going backwards, apart from that crazy, awesome May.”
“And when you go and multiply that by continually reducing system prices, the money that’s flowing into the industry is going backwards for sure.”
Johnston said recent analysis has revealed how soft the market for leads, proposals, and sales was, and that appears to have now flow through to system registration.
“All signs point to people not parting with their money so easily,” he said. “People are taking a lot longer to decide to buy a new system and when they do it’s smaller and cheaper for those that are buying residential than it has been of late.”
Johnston said the decline in installations, and a drop off in prices, means revenues are going backwards for the market total with pressure mounting on solar retailers.
“There hasn’t been a huge amount of exits but we know for sure there are businesses that are exiting the market,” he said. “And we are seeing a bit of downsizing happening, businesses letting go of this team or that team so that they can actually stay on.”
The number of retailers is however staying reasonably static with new companies entering the market.
“Often what drives people setting up new retailers in this market is often that those people have been that let go say ‘well I’ll start my own business now’,” Johnston said. “So perhaps this solar coaster is more of a merry-go-round, though most wouldn’t describe it as merry.”
All state volumes went backwards in June 2024 with Queensland faring best of the large states with a 12% decline on the previous month. South Australian suffered a 21% decline, Victoria dropped off by 15%, and New South Wales (NSW) 14%. Western Australia and Tasmania both observed an 18% decline in installations while the Australian Capital Territory and the Northern Territory both suffered 11% declines.
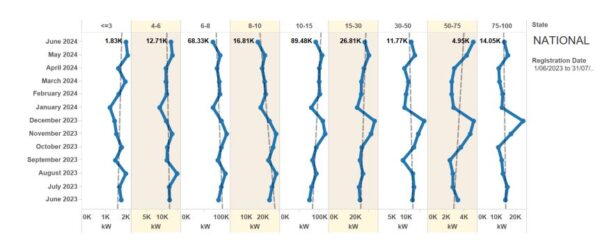
Image: SunWiz
Over June 2024, residential rooftop was the hardest hit with the 50-75 kW segment the only one that grew. The sub 3 kW and 4-6 kW segments decreased in total volume by 4% and 3% respectively while the 6-8 kW and 10-15 kW segments declined by 20% and 15% respectively, a result attributed in part to affordability.
Most of the commercial rooftop solar sector went backwards, but to a lesser extent than the residential ranges. The 15-100kW market contracted for the first time this year, falling back to levels that were ahead of 2023 figures and level with 2021 figures.
The average rooftop solar system size increased to 9.9 kW, its second highest month in recent times.
This content is protected by copyright and may not be reused. If you want to cooperate with us and would like to reuse some of our content, please contact: editors@pv-magazine.com.


It is ironic that in spite of large deployment of pollution free solar facilities the use of “dirty” facilities remain the same at ~ 1+TW even in 2050. It may be pointed out that every 6.5TW of PV panels, generating 1200hrs/yr at rated capacity, deliver the same electricity as a 1TW fossil plant, generating rated power for 7-8,000hrs/yr. In other words, in 2050, dirty electricity from fossil plants will be about the same as the proposed PV/RE Plants. Who are they kidding???