In the last quarter of 2024, distributed solar was a standout for its record breaking output in both the national electricity market (NEM) and Western Australia’s (WAs) wholesale electricity market (WEM), according to the Australian Energy Market Operator’s (AEMOs) Quarterly Energy Dynamics (QED) report.
Distributed solar output in all NEM regions in Q4 2024 showed an average output of 4,054 MW, which is 18% higher than the previous record set in the same 2023 period, and it also drove new all-time minimum demand records for the NEM, where the average operational demand was slightly lower, at 19,683 MW, down 0.3% from Q4 2023.
Queensland, New South Wales (NSW), South Australia (SA) and Tasmania were at the forefront of the lower demand, where both Queensland and NSW have surpassed 1 million rooftop solar installations, and over 40% of South Australian homes have rooftop solar installed.
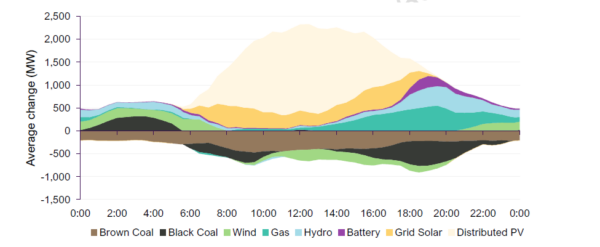
Image: Australian Energy Market Operator
NEM wholesale prices
Grid-scale solar output was also at a new quarterly high average of 2,212 MW, up 9% and a record high of 23% of intervals experienced negative or zero wholesale prices across the NEM.
NEM wholesale spot prices averaged $88 (USD 54) / MWh over Q4 2024, up 83% from the corresponding quarter last year, with NSW ($143 / MWh) and Queensland ($127 / MWh) at Q4 record highs, while NEM wholesale prices were 26% lower than Q3 2024’s average of $119 / MWh, the report says.
Average wholesale prices in SA ($52 / MWh) and Victoria $45 / MWh) were at less than half the level of the northern regions with constraints on Victoria to NSW Interconnector (VNI) frequently limiting the northwards transfer of lower-cost energy.
With the high-voltage direct current (HVDC) electricity cable that connects Victoria and Tasmania, Basslink’s capacity to transfer lower-cost energy from Victoria often fully utilised during daylight hours, wholesale spot prices in Tasmania averaged $74 / MWh for the quarter.
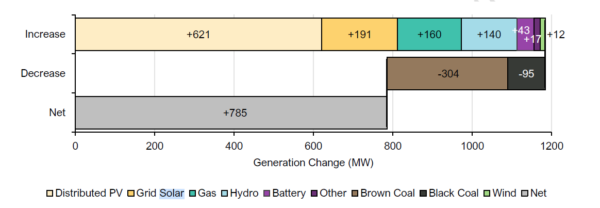
Image: Australian Energy Market Operator
Renewable sources
A half-hourly basis record was also set on 6 November 2024, when renewables contributed 75.6% of total NEM generation, while on average renewable sources recorded a 46% share of the overall NEM supply mix.
AEMO’s report shows the contribution of coal-fired generation dipped below 50% for the first time in Q4 2024, driving quarterly NEM total emissions down by 1.7% and emissions intensity down by 3.2%, to record low levels.
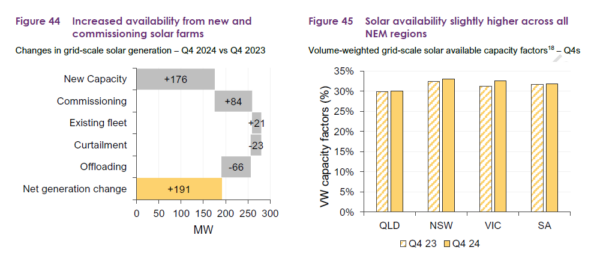
Image: Australian Energy Market Operator
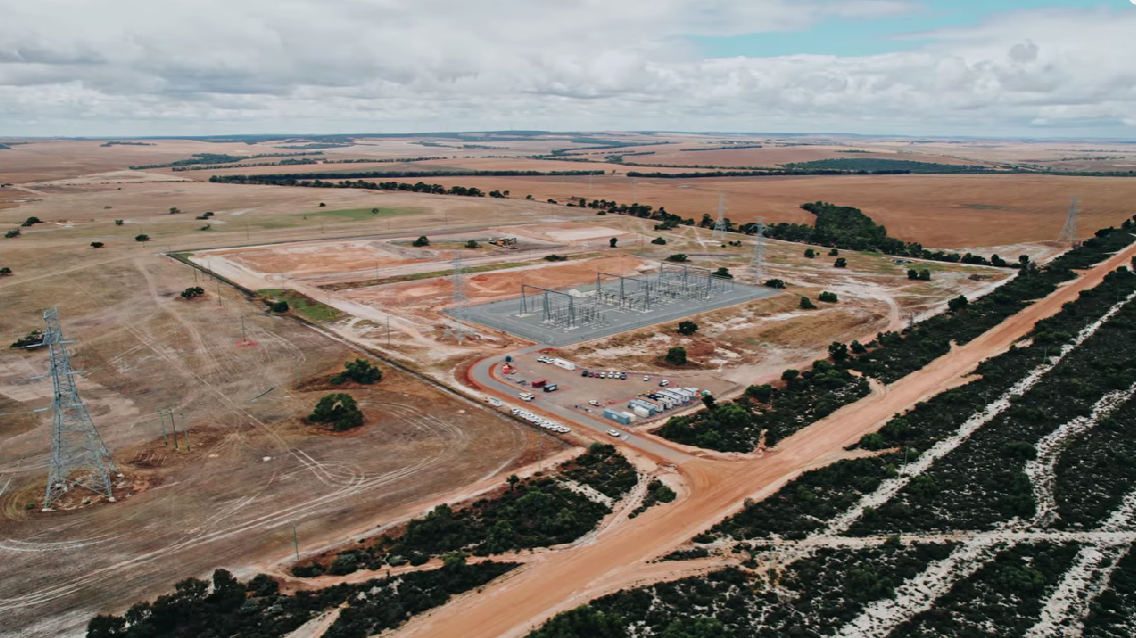
Western Australia (WA)
WA’s Wholesale Electricity Market (WEM), which supplies electricity to WA’s southwest via the South West Interconnected System (SWIS), saw the average underlying demand increase to a new Q4 high up 4.3% to 2,539 MW, or 105 MW higher than during Q4 2023.
The report says this was offset by a 110 MW (+20%) uplift in distributed solar leading to a 16.7 MW (‑0.9%) reduction in average operational demand.
The 20.3% uplift of distributed solar along with gas by 97 MW (+14.4%) and batteries by 33 MW (from a base of 2.2 MW in Q4 2023), filled gaps left by coal power plant facilities, which provided 139 MW less (-19.5%) in the quarter compared to Q4 2023.
The WEM experienced maximum underlying demand (5,263 MW) and maximum Q4 operational demand (4,163 MW) records, as well as minimum operational demand (511 MW) and minimum unscheduled operational demand (474 MW) records, during the quarter.
WA big batteries
The report says of WA’s additional 425 MW of battery capacity either completed prior to Q4 2024 or undertaking commissioning tests during the quarter, contributed an average 116 MW (up 112 MW from Q4 2023) withdrawal during minimum demand periods and an average 103 MW (up 97 MW) generation during peak demand periods.
Batteries also participated in the frequency co-optimised essential system service (FCESS) markets for the first time in a Q4, capturing 36% market share (from 0% in Q4 2023) by volume, displacing gas and coal.
Contribution from renewables in WA set a new all-time quarterly high of 46.4%, a 3.6 percentage point (pp) increase on the previous record observed in Q4 2023 and was largely driven by distributed solar contribution increasing 3.4 pp (to 25.8%) and battery contribution increasing 1.3 pp (to 1.4%).
The report says, the WEM also experienced its highest peak renewable contribution of 85.1% during the 13:35 interval on 17 November 2024.
The average energy price in the WEM in Q4 2024 was $79.93/MWh, a decrease of $3.70/MWh (-4%) from Q4 2023 and similar to Q3 2024’s average energy price of $80.15.
This content is protected by copyright and may not be reused. If you want to cooperate with us and would like to reuse some of our content, please contact: editors@pv-magazine.com.


By submitting this form you agree to pv magazine using your data for the purposes of publishing your comment.
Your personal data will only be disclosed or otherwise transmitted to third parties for the purposes of spam filtering or if this is necessary for technical maintenance of the website. Any other transfer to third parties will not take place unless this is justified on the basis of applicable data protection regulations or if pv magazine is legally obliged to do so.
You may revoke this consent at any time with effect for the future, in which case your personal data will be deleted immediately. Otherwise, your data will be deleted if pv magazine has processed your request or the purpose of data storage is fulfilled.
Further information on data privacy can be found in our Data Protection Policy.