Green Energy Markets (GEM) has charted the growing contribution of solar to Australia’s fleet of electricity generators in 2018, “with a far bigger impact to be seen this year,” says GEM’s Director of Analysis and Advisory Tristan Edis. The analysis was released today in GEM’s Renewable Energy Index report for December 2018.
The share of all renewables also had a banner year in 2018, contributing 21.3% of Australia’s electricity – the first time the 20% milestone had been reached in four decades. For the month of December, renewable share came in slightly higher at 23.2%.
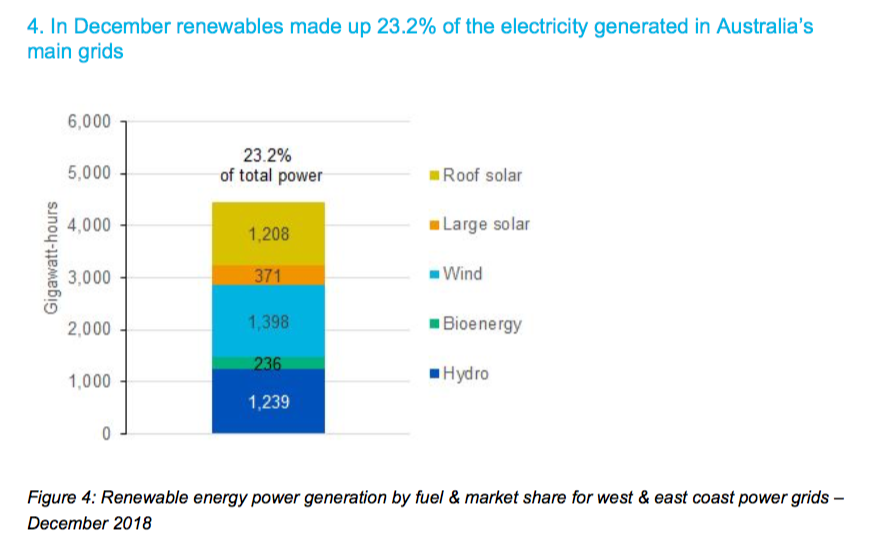
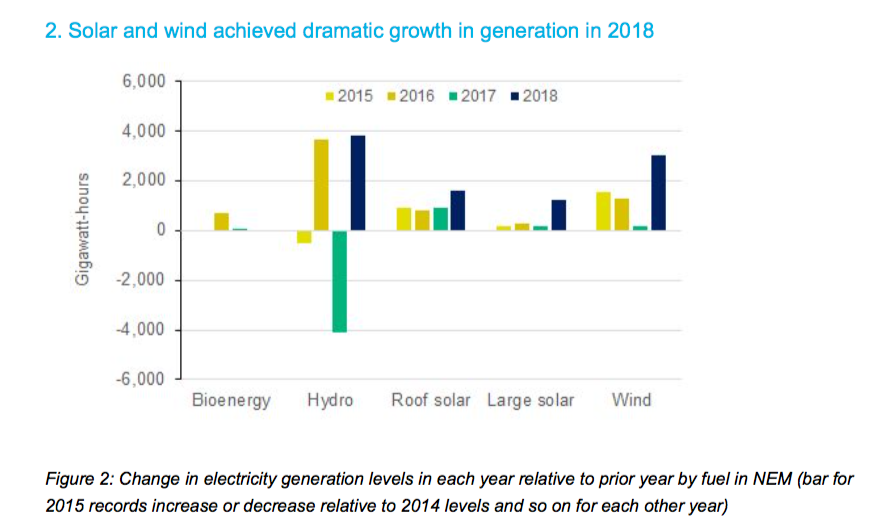
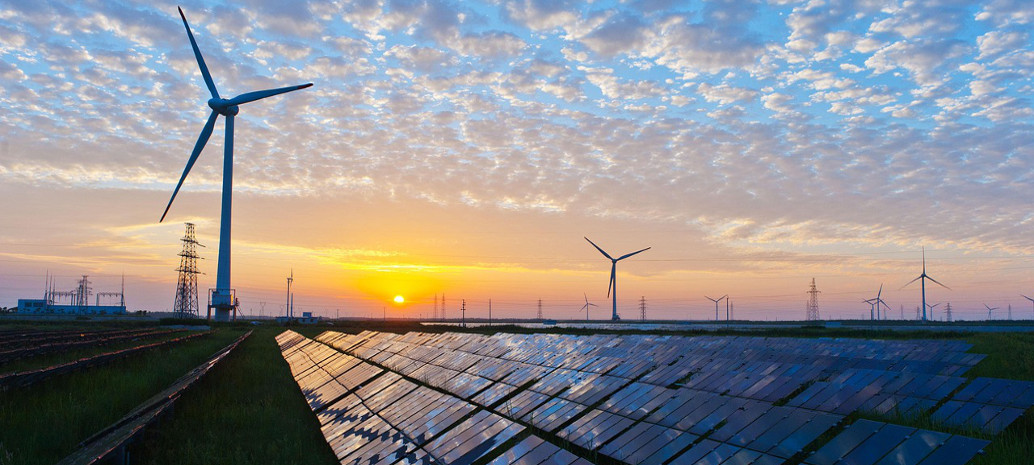
“For wind the 26% jump in generation this year came after almost no growth in 2017,” writes Edis in the latest Renewable Energy Index report. “Rooftop solar has had more steady additions of generation, but 2018 was exceptional with the incremental new generation 86% greater than the average annual additions of 2015-2017. Yet it was large scale solar farms that really jumped out of the blocks in 2018 with generation leaping up by almost 300% on the prior year.”
Alongside solar PV and wind, hydro also had an “up year” notes Edis, although its contribution is likely to fall in 2019 as more solar and wind comes online.
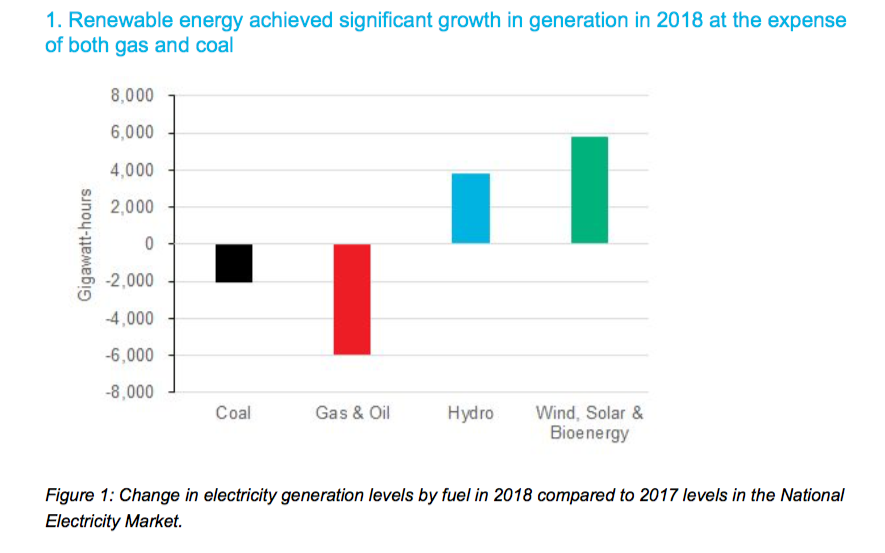
On the flipside, the GEM analysis notes that while the renewable generation gains were made at the expense on brown coal and gas, “the large gains in black coal generation since the carbon price was abolished still remain.”
Gas generation on the National Electricity Market (NEM) fell 26% in 2018, solar and wind grew by 35% and 26% respectively.
While the growth in renewable generation was charted by GEM on a national basis, the increase was limited to the east coast, with Western Australia continuing to miss out on the current renewables boom in 2018.
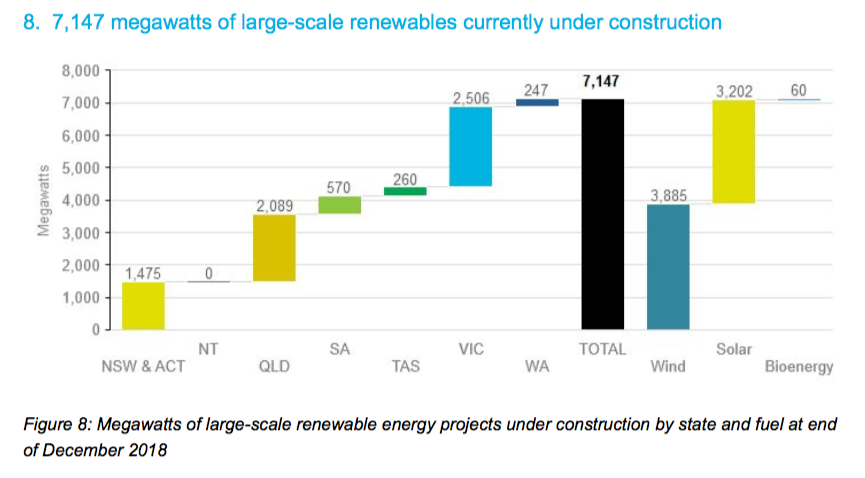
In December, the Renewable Energy Index finds, over 3.2 GW of large scale solar projects are currently under construction – of a total of close to 7.15 GW. Big solar project construction is employing close to 7,700 people.
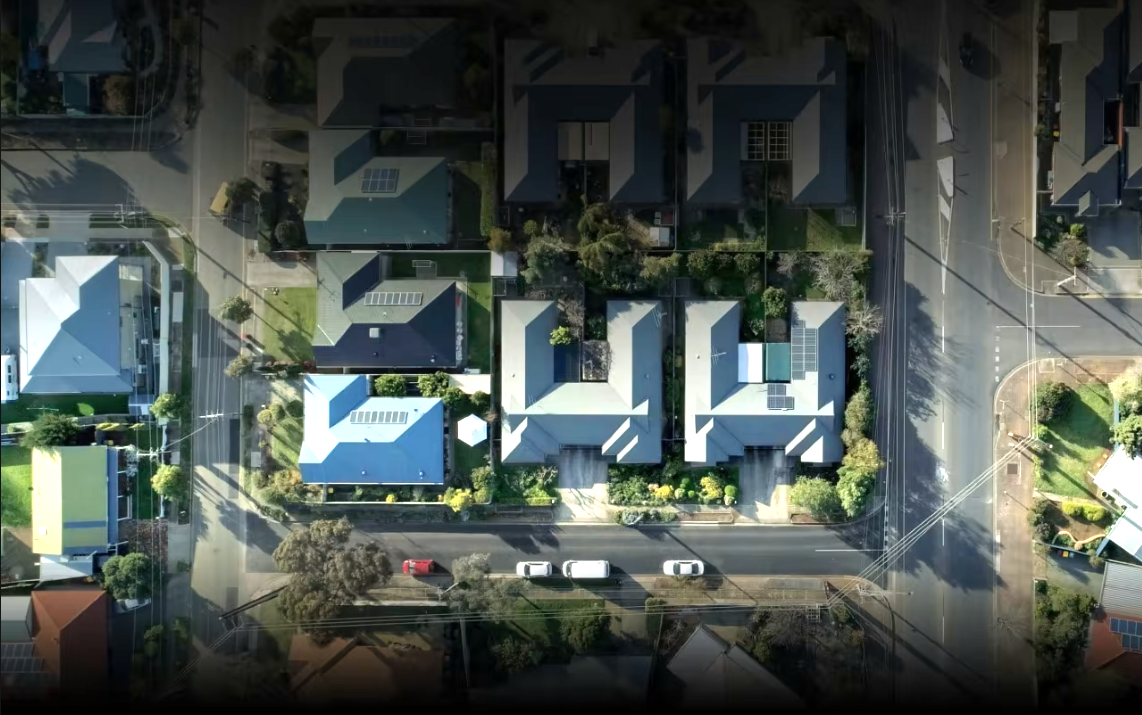
Turning to the rooftop, GEM finds that 22,010 PV systems were installed in December 2018. New South Wales and the Australian Capital Territory (combined) was the leading region, with almost 5,700 systems, followed by Victoria with 5,400, Queensland (5,300), Western Australia (3,150), South Australia (1,900), the Northern Territory (269) and Tasmania (262).
This content is protected by copyright and may not be reused. If you want to cooperate with us and would like to reuse some of our content, please contact: editors@pv-magazine.com.


3 comments
By submitting this form you agree to pv magazine using your data for the purposes of publishing your comment.
Your personal data will only be disclosed or otherwise transmitted to third parties for the purposes of spam filtering or if this is necessary for technical maintenance of the website. Any other transfer to third parties will not take place unless this is justified on the basis of applicable data protection regulations or if pv magazine is legally obliged to do so.
You may revoke this consent at any time with effect for the future, in which case your personal data will be deleted immediately. Otherwise, your data will be deleted if pv magazine has processed your request or the purpose of data storage is fulfilled.
Further information on data privacy can be found in our Data Protection Policy.