From pv magazine 06/2022
The HTW’s “Energy Storage Inspection 2022” (ESI22) assessed a relatively large number of BESS, including established providers such as BYD and Sonnen, but also new products from Fenecon, Solax, Varta and others. The program focuses on residential battery systems.
All BESS manufacturers were invited to take part in the ESI22. 14 manufacturers participated in the comparison of their systems with measurement data of 22 systems. Laboratory tests were conducted by independent testing institutes in accordance with the “Efficiency Guideline for PV Storage Systems.”
Comparable specs
Next to the quality of the product and warranty, the efficiency of a system is one of the top five criteria for buying a certain storage system. Unfortunately, comparable specifications in datasheets are rarely seen. The objective of the annual storage ranking is to provide a better comparison between various products.
Since the first HTW inspection in 2018, over 60 different storage systems have been compared with measurement data from independent testing institutes. The results show that many manufacturers have identified and employed key mechanisms to improve the efficiency of their products.
As a result of the improvements, increasingly efficient PV energy storage systems are now available on the market. Homeowners that dearly want more independence from rising electricity prices benefit from this development. The lower the system losses are, the higher the homeowner’s degree of self-sufficiency for their electricity supply.
Residential surge
About 93,000 PV systems were registered in 2019 in the German energy market data register, with that number growing to 162,000 in 2020. The market for battery systems up to 20 kWh in capacity shows similar significant growth. The number of storage systems registered doubled from 2019 to 2020, reaching 82,000 installations.
Moving forward, in 2021 more than 200,000 PV systems and 130,000 battery storage systems were installed. In 2019, only 37% of new PV systems were installed alongside a battery storage system. This number went up to 56% in 2021. In addition to that, an increasing number of private homeowners PV systems decide to add storage to their existing PV system. The core energy market data register shows that in 2021 more than 16,000 existing PV systems got a storage upgrade. In 2019 a combined 724 MW was installed. This number nearly doubled in 2020 with 1,285 MW and grew further to 1,697 MW in 2021.
System efficiency
The residential storage systems were assessed according to the System Performance Index (SPI) metric. This is done by simulating battery system operational behaviour over a period of one year. The results of a real PV-storage system and a theoretical loss-free system are compared to calculate the SPI.
Thus, comparable to the performance ratio (PR) of a PV system, the SPI rates the general efficiency of a solar-plus-storage system. Two independent reference scenarios were used for benchmarking various system sizes. These two scenarios naturally differ in the size of the PV system (5 kW and 10 kW), the household electricity demand, and its composition (5010 kWh/a and 9362 kWh/a). The PV system size is responsible for the two chosen names SPI (5 kW) and SPI (10 kW).
System parameters
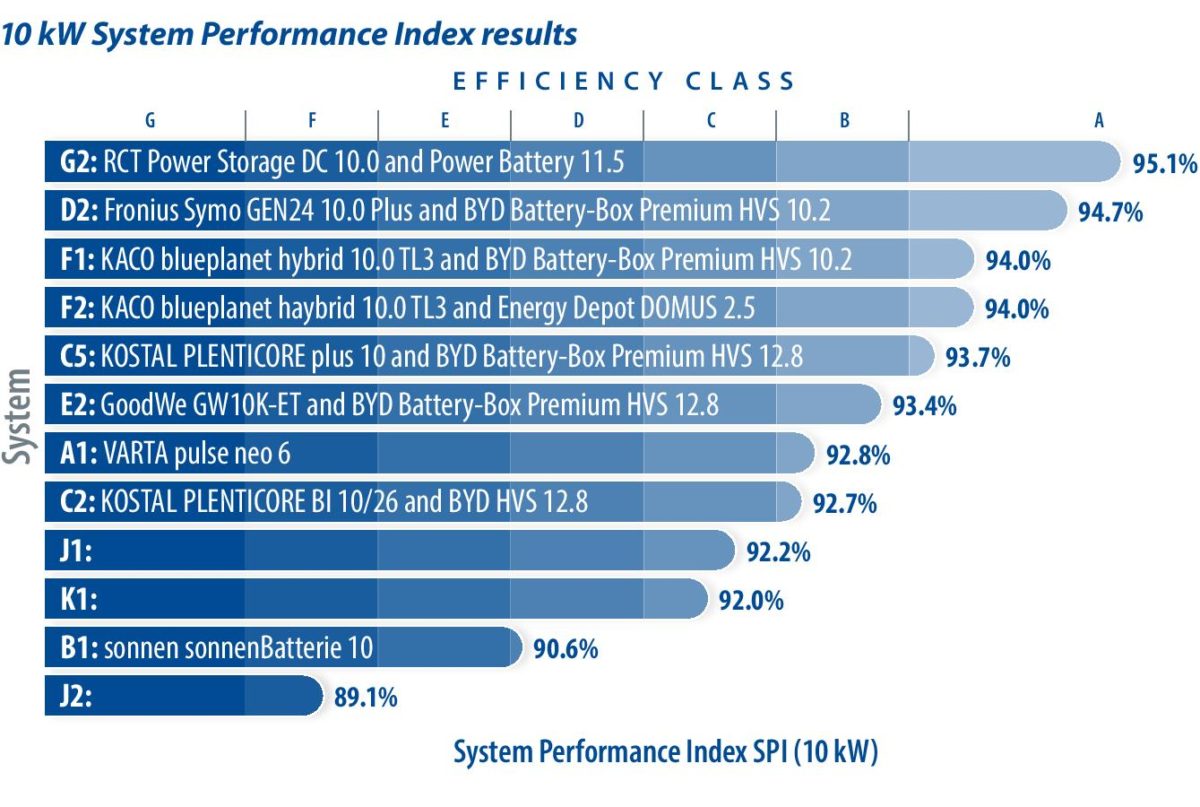
12 systems were assessed by SPI (10 kW) within the ESI22. To each analysed system an abbreviation (e.g. A1) was assigned in the reporting. Two manufacturers chose to participate anonymously. System G2 managed to achieve the highest SPI (10 kW) with 95.1%. System J2 only got an SPI (10 kW) of 89.1%, mainly caused by its high conversion and standby losses.
Every energy conversion with electronic power components and battery storage results in some losses. Battery efficiencies of the analysed systems vary from 93.3% to 97.8%. The average efficiency of the lithium-ion batteries in the study came in at 95.8%. While the most efficient systems manage to reach pathway efficiencies up to 97%, less efficient systems often have pathway efficiencies below 88%.
Loss analysis
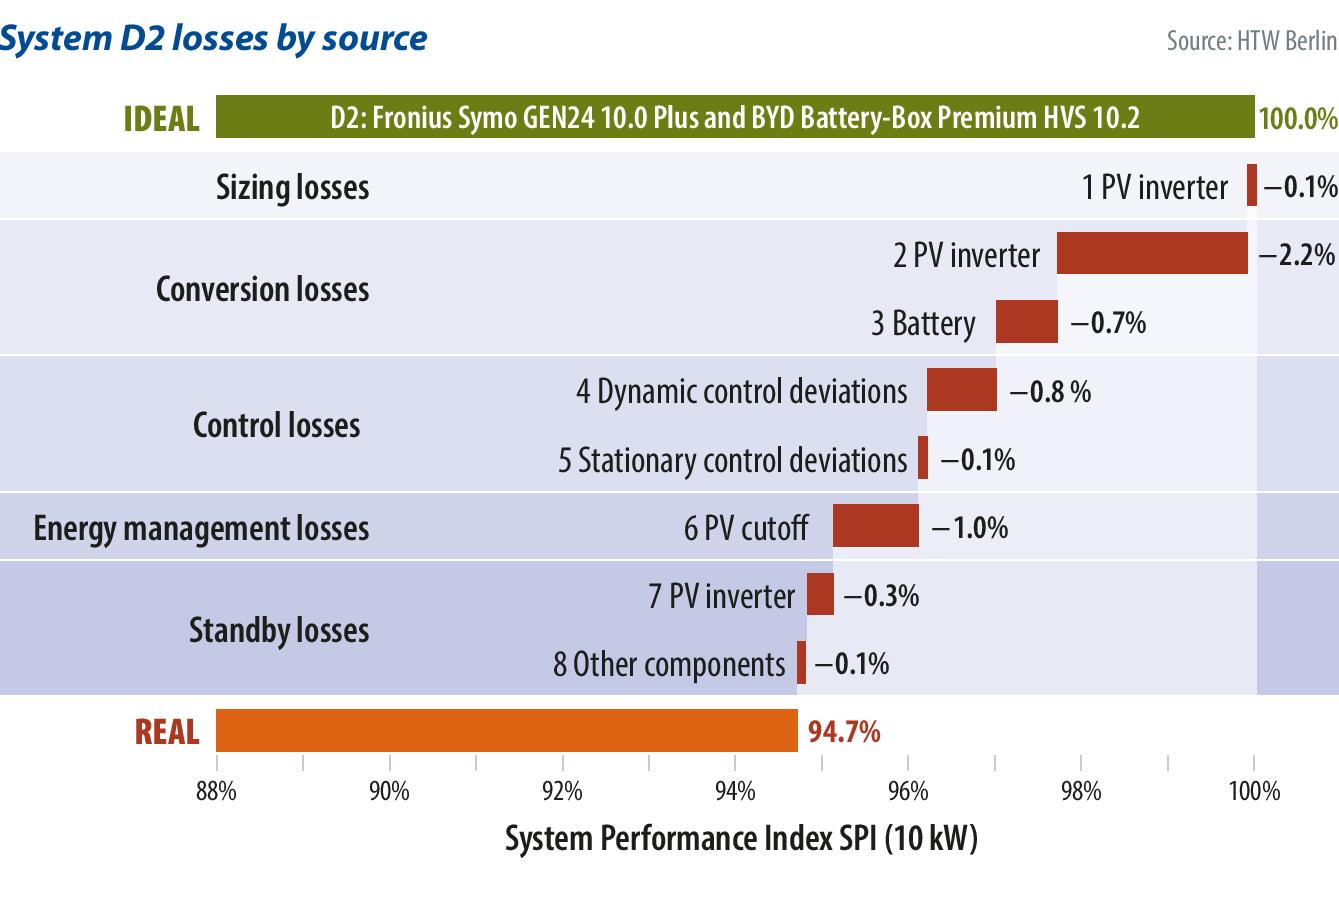
With the model-based approach, various loss mechanisms of a battery system can be isolated. The chart (right) shows a detailed overview of the different losses with the D2 system. As the system with the second-highest SPI result, the D2 has superior conversion losses of only 2.9% – 0.5% less than the conversion losses of the best-placed system G2.
System J2 has the highest conversion losses with 7.2%. This system has higher conversion losses than the absolute losses of the top six placed systems, G2 to E2. These losses are primarily the result of low conversion efficiency while discharging. Even though D2 has an outstanding general performance, the control losses of the system are comparably high at 0.9%. By comparison, G2 has control losses only slightly higher than 0.2%. Even more significant losses due to high control deviations can be found in systems J2 (1.1%) and B1 (1.4%). System D2 has relatively low standby losses with only 0.4%. J2 additionally has the highest standby losses with 1.7%. The below-average losses of D2 in nearly every loss category result in an extremely high SPI (10 kW) of 94.7%.
Control and standby losses
Common to the various loss sources is that they affect energy flows between the building and the grid. Dynamic and/or stationary control deviations result in an undesired rise in grid feed-in. Preventing this is the primary source of the control losses of a PV-energy storage system.
Independent testing institutes have analysed the system behaviour in response to fluctuating power demand with a step response test. Manufacturers focus on the optimisation of the system control. The average settling time was 8.1 seconds in 2018, and fell to 4.2 seconds in 2022. Systems with exceptionally good behaviour can control power fluctuations within hundredths of milliseconds. But there are still products that provide a settling time as long as 12 seconds with a dead time of three seconds.
The standby power consumption of a system with a charged or discharged battery represents another cause of energy losses. The magnitude of this loss is dependent on the power demand and the time that the system typically spends at a fully charged or discharged state. A PV battery spends annually between 2,000 and 4,000 hours discharged but only 1,000 to 2,000 hours in a fully charged state. Other components like power sensors need to be supplied with power throughout the whole year.
Efficient systems can achieve less than 2 W in losses resulting from standby power consumption, but one of the analysed systems has a standby consumption of more than 70 W. The average standby consumption of all systems stood at 20 W in 2021. Over the past five years, the standby power consumption of the analysed systems has increased. This trend is a result of the installation of inverters and batteries with larger capacities. The results of the storage comparison show that many systems have a large potential for optimisation in this regard.
Achieving independence
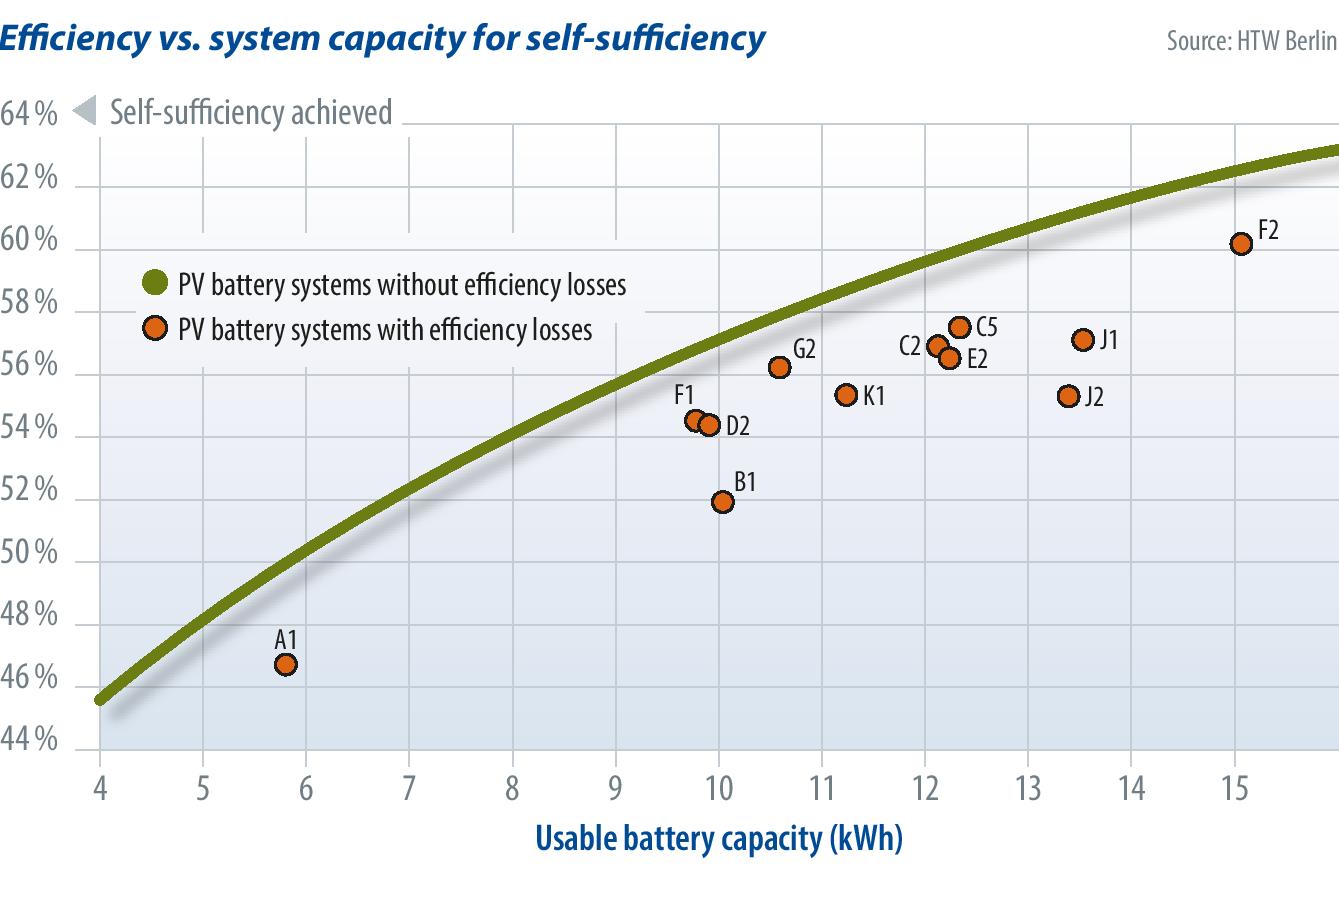
The degree of self-sufficiency that can be achieved is determined by how much of a household’s electrical demand can be covered by the rooftop PV system. The chart (left) depicts the self-sufficiency that can be achieved by the assessed systems. In addition, the degree of self-sufficiency for an ideal system without losses is calculated, which is shown by the green line. The plotted line illustrates how the degree of self-sufficiency relates to the size of the battery. Efficiency losses reduce the degree of self-sufficiency. The bigger the distance between the theoretical maximum and the real system at the same capacity, the higher the losses.
This demonstrates that increased battery capacity does not necessarily result in higher self-sufficiency scores. For example, if a 10 kWh battery system is coupled with a 10 kW rooftop PV system, the maximum degree of self-sufficiency that can be achieved is 57%.
Looking at the battery systems tested, both F1 and D2 have only a minor difference of 2.5% between the theoretically attainable and real-world degree of self-sufficiency that can be achieved. The high losses that occur on the B2 system result in a degree of self-sufficiency that is 5.1% lower than the theoretical maximum. System G2 achieved a higher degree of self-sufficiency than the nearly 3 kWh bigger and less efficient J2 system. This shows that system efficiency can be vastly more influential on the self-sufficiency than can be achieved in comparison to the usable battery capacity metric.
About the authors
Lucas Meissner is currently finishing his bachelor’s degree in renewable energy engineering at HTW Berlin. As a working student, he is part of the solar storage systems research group.
Johannes Weniger initiated the annual Energy Storage Inspection in 2018. Since 2013, he is part of the solar storage systems research group at HTW Berlin. Johannes Weniger holds a PhD from the Technical University of Berlin.
Nico Orth is a research associate in the research group solar storage systems led by Prof. Volker Quaschning at the University of Applied Sciences (HTW) Berlin. In the research project Perform, he analyses and compares the performance of PV-storage systems.
This content is protected by copyright and may not be reused. If you want to cooperate with us and would like to reuse some of our content, please contact: editors@pv-magazine.com.


1 comment
By submitting this form you agree to pv magazine using your data for the purposes of publishing your comment.
Your personal data will only be disclosed or otherwise transmitted to third parties for the purposes of spam filtering or if this is necessary for technical maintenance of the website. Any other transfer to third parties will not take place unless this is justified on the basis of applicable data protection regulations or if pv magazine is legally obliged to do so.
You may revoke this consent at any time with effect for the future, in which case your personal data will be deleted immediately. Otherwise, your data will be deleted if pv magazine has processed your request or the purpose of data storage is fulfilled.
Further information on data privacy can be found in our Data Protection Policy.