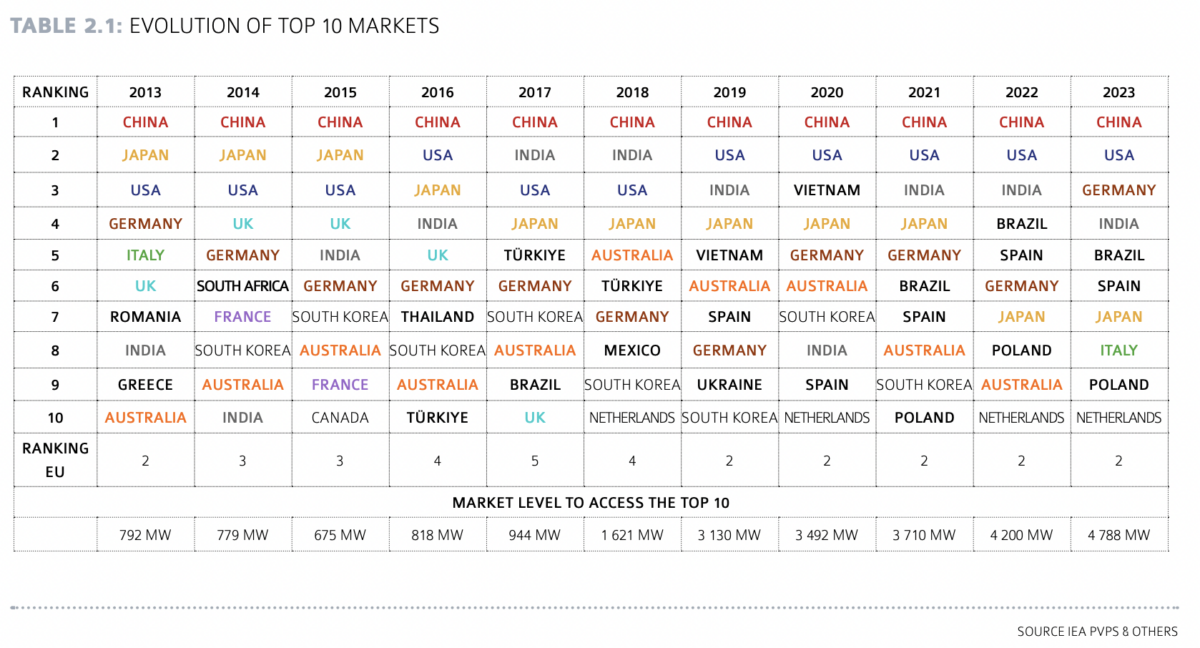
Australia losing its place among the world’s top 10 solar installers can be viewed both as a sign of industry maturity, with all the complications and opportunities this brings, and a falling out of the global ‘game.’
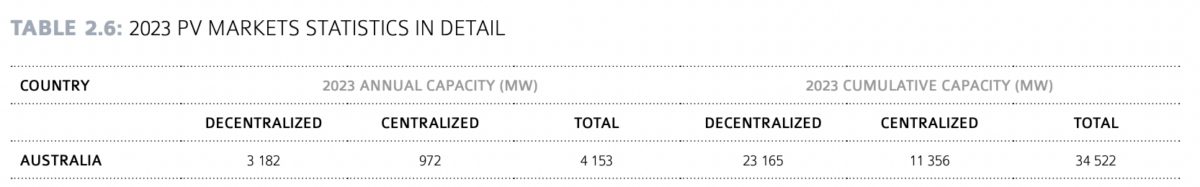
This is to say, the International Energy Agency’s most recent global Photovoltaic Power Systems Programme (PVPS) report paints a complicated picture, in which Australia remains one of solar’s most compelling characters. Rather than an abject policy failure, the report notes Australia’s solar plateauing solar installation rate, which has hovered around the 4 GW mark for a number of years, is primarily linked to it reaching “market competitiveness across most segments.”
Australia’s solar pioneer status means it is now hitting penetration rates that require its markets to evolve, with the International Energy Agency (IEA) noting it is one of the most dynamic regions when it comes to storage, particularly battery storage, supply and demand dynamics, grid limitations, corporate Power Purchasing Agreements (PPAs) and, surprisingly, electric vehicle uptake.
Storage and big batteries
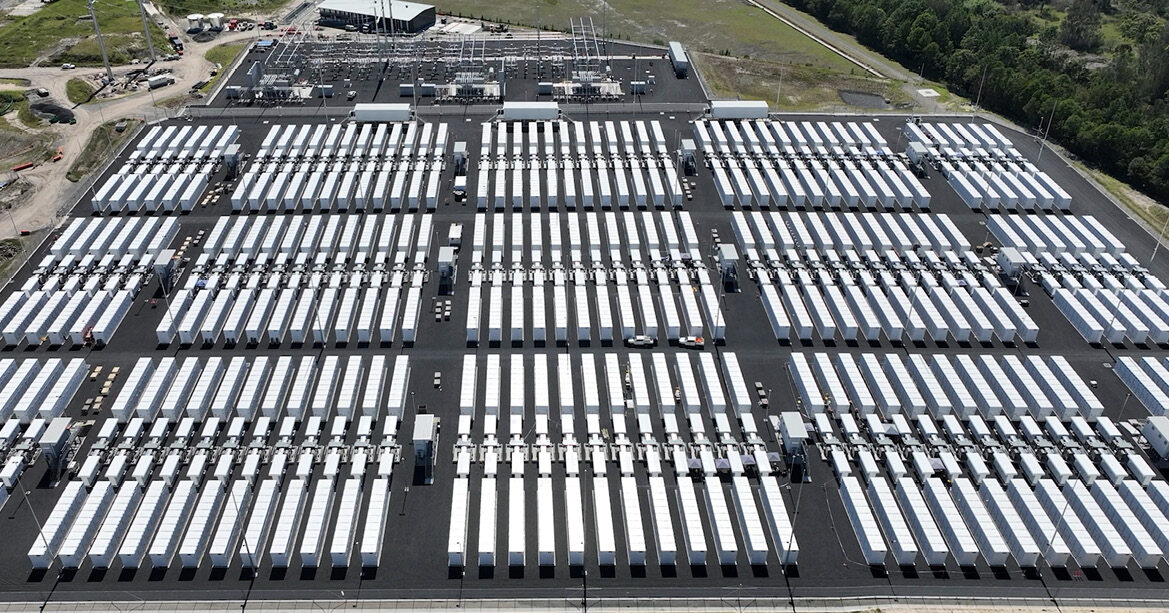
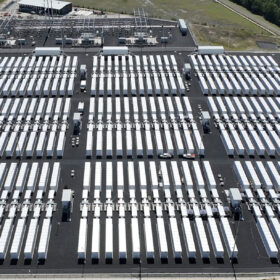
The IEA report notes that as of 2023, Australian big batteries supplied more than 50% of the frequency control ancillary services to its grid. This, it noted, is “fast making traditional coal or gas services redundant, whilst distributed batteries are reducing service loads on turbine generation.”
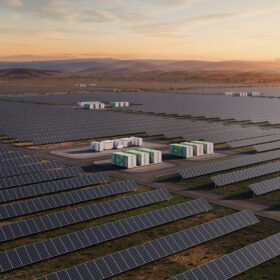
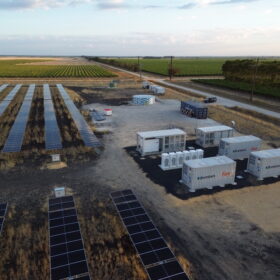
For the IEA, Australia was one of the world’s most noteworthy markets for its storage system additions, alongside Germany and the US. What makes Australia a particularly attractive market for storage is linked this grid services evolution, as well as its wholesale energy markets which are seeing pricing spreads increase significantly driven by solar plummeting daytime demand and undercutting the returns of baseload power generators, opening the field for new players which can operate in the evenings and nights.
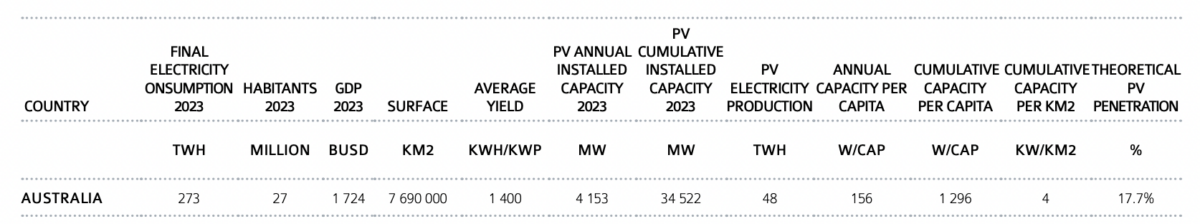
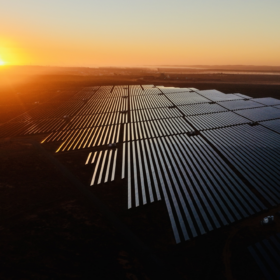
Image: IEA PVPS report 2023
Grid dynamics
The other pertinent factor in Australia’s solar installation plateau is well known: grid congestion. Both Australia’s physicality as a large country with a little population, and its solar penetration plays into this. “As grids in some parts of the world become more congested, or as distributed solar outpaces consumption, curtailment policies are put in place that no longer guarantee access to the network at all times,” the report reads, specifically pointing to Australia and South Korea.
“Australia is investing in new grid capacity to facilitate further development of utility-scale PV as it heads into what is expected to be regular 100% renewable supply over several hours,” the IEA notes.
While Australia is not alone in its need to invest in grid capacity to allow more utility-scale solar, it is having to come up with unusual solutions to this in the regions. “In some countries, most notably in Australia, as grid infrastructure becomes fragile in the face of extreme climate events (heat waves, fires, floods and storms), micro-grids are being built in edge-of-grid situations to reduce the cost of replacing damaged infrastructure and to provide more resilience for local populations.”
EVs and other tid bits
The IEA notes that solar update is having a knock on effect of encouraging electric vehicles. In the EV industry, the report notes growth was “particularly dynamic in… Australia, Canada, China, Spain, Switzerland and Türkiye, Thailand, Malaysia.”
While Australia is coming from a low base, EV update has been growing exponentially in the last few years with households and governments looking to make the most of the flooded daytime grid.
Moreover, the IEA report notes that Australia’s resource mining and heavy industry are also rapidly evolving their power sources, with these industries accounting for one third of corporate solar PPAs in 2023.
Formal solar support schemes
It is within this context that Australia’s phasing out of government solar support schemes must be viewed. As the report notes, Australia is one of the “few countries” phasing out government-based FiT schemes as grid parity is reached.
As Renate Egan, Executive Director for the Australian Centre for Advanced Photovoltaics, noted during her All Energy session on Thursday, Australia’s solar installations have been buoyed by distributed systems, with particularly strong growth in the commercial and industrial (C&) segment.
This has allowed the country’s installation rate to remain relatively steady, even though utility-scale projects have taken a dive – the result of grid congestion, low daytime power demand, alongside the phase out of large-scale generation certificate schemes.
Australia’s new federal renewables tenders, known as the Capacity Investment Scheme, are hoping to bring new life to the flailing large-scale segment. Notably, the scope of the latest auction round was this week increased, with the storage component doubling – undoubtedly in response to some of these dynamics caused by Australia’s solar maturity.
“I’m hoping that some of the government initiatives will drive that growth again,” Egan told All Energy.
In terms of the value of Australia’s solar industry, the nation ranks 7th in the world, with absolute value sitting at USD 5.9 billion ($8.91 billion).
Countries participating in the latest IEA PVPS report include Australia, Austria, Belgium, Canada, China, Denmark, Finland, France, Germany, Israel, Italy, Japan, South Korea, Malaysia, Morocco, the Netherlands, Norway, Portugal, South Africa, Spain, Sweden, Switzerland, Thailand, Türkiye, and the United States of America.
This content is protected by copyright and may not be reused. If you want to cooperate with us and would like to reuse some of our content, please contact: editors@pv-magazine.com.


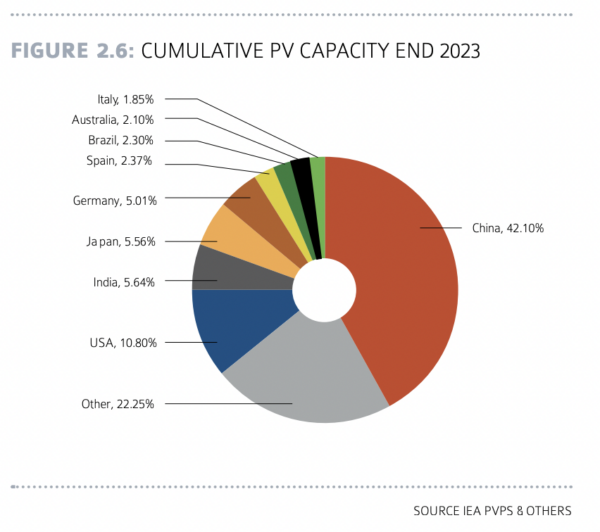
Perhaps, instead of simply publishing total numbers for each country, the comparisons would be more realistic, practical, and, relevant, by publishing the numbers for comparison, ion a p[er capita basis.
To compare the national quantities, rather than per capita quantities, for comparison, between countries like China and Australia, with the population pof China, being however many hundreds times the population of Australia, makes the comparisons of much less value.
And, New Zealand, which has a population that is about a fifth of the population of Australia, and, possibly, a hundred thousandth of the population of China (guessed proportion, not verifiable proportion), the comparisons are grossly distorted.
I lis like a similar comparison between Western Australia and New South Wales, in terms of quantities of household rooftop photovoltaic installations.
So, please, republish the comparisons, using per capita quantities, rather than simply national quantities, to make the comparisons more worthwhile.
Yes, when looking at installations per capita, China, situated between latitudes 20 and 50, averaging around the 30th parallel, is still far from matching Estonia, located closer to the 60th parallel. To achieve this, they would need to double their annual PV installation capacity, which already accounts for more than half of the global total.