Driven by high electricity prices and falling costs of solar, Australia’s rooftop solar sector keeps on growing at an unprecedented pace.
The latest figures released by the Clean Energy Regulator showed that there were panels on over one-fifth of all Australian homes as of last week.
“Homes with rooftop solar installed are saving on average of about $540 per year on their electricity bills,” Clean Energy Council Chief Executive Kane Thornton said.
“Solar is a clear way for consumers to take control of their power consumption and cut costs, and it’s growing quickly by word-of-mouth.”
The greatest uptake is seen in the Sunshine State of Queensland and South Australia, both of which have around one third of homes with solar installed or around double as many as in New South Wales and Victoria.
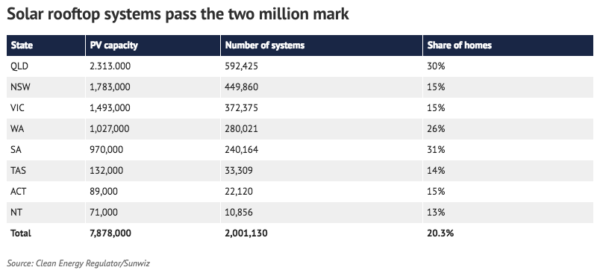
Among the nation’s top five solar postcodes, Bundaberg in central Queensland topped the list for the highest number of households with solar power, followed by Mandurah in Western Australia, and three other Queensland locations: Hervey Bay, Caloundra and Toowoomba.
“An average of six panels per minute are being installed in Australia, with the Australian Energy Market Operator estimating an average of 10-20 panels per minute if large-scale solar projects are factored in,” Thornton said.
In her address at a CEDA event last week, AEMO CEO Audrey Zibelman also highlighted the rapid rooftop solar uptake, noting that Australia is adding 10 MW of solar each day.
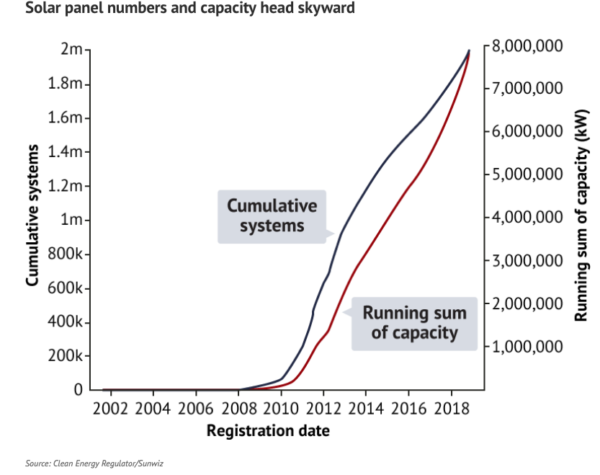
While it took Australia 30 years to reach one million homes with solar in February 2013, and just five more to reach two million, the three million milestone is expected to come even faster based on the current installation rates.
Further evidence on solar’s growing contribution to Australia’s energy mix comes from the National Electricity Market (NEM), which supplies around 80% of Australia’s electricity consumption.
Last week, solar was the second most dominant source of energy on the NEM with 8.1% after coal that still claims the lion’s share.
NEM stats — week ending 02 Dec:
NEM generation by technology
• Solar: 8.1%
• Wind: 5.4%
• Hydro: 7.0%
• Gas: 7.5%
• Coal: 71.5%Renewable contribution to demand:
• NSW: 12.7%
• VIC: 19.4%
• SA: 48.0%
• TAS: 98.4%
• QLD: 10.0%
• NEM: 20.5%— OpenNEM (@OpenNem) December 3, 2018
Since rapid uptake may equate to rushed purchase, the issue of quality is garnering a lot of attention. The Clean Energy Council underlines that thorough consideration is crucial when choosing installers and retailers.
“Installing solar is a big decision,” Thornton said. “By choosing Clean Energy Council Accredited Installers and Approved Solar Retailers, customers can be sure their new system is installed correctly and safely and provides all the expected long-term benefits of rooftop solar.”
This content is protected by copyright and may not be reused. If you want to cooperate with us and would like to reuse some of our content, please contact: editors@pv-magazine.com.



3 comments
By submitting this form you agree to pv magazine using your data for the purposes of publishing your comment.
Your personal data will only be disclosed or otherwise transmitted to third parties for the purposes of spam filtering or if this is necessary for technical maintenance of the website. Any other transfer to third parties will not take place unless this is justified on the basis of applicable data protection regulations or if pv magazine is legally obliged to do so.
You may revoke this consent at any time with effect for the future, in which case your personal data will be deleted immediately. Otherwise, your data will be deleted if pv magazine has processed your request or the purpose of data storage is fulfilled.
Further information on data privacy can be found in our Data Protection Policy.