The COVID-19 infection curve is not the only graph under close inspection this year; in the renewable energy industry, Australia’s solar curve has become a widely discussed ‘challenge’. At Flow Power, an energy utility which helps businesses to unlock value from the wholesale energy market, we have a data-based view on how one curve is influencing the other.
Dubbed ‘the duck curve’ thanks to its shape, the solar curve represents the increase in solar generation during the middle of the day when the sun is shining, but while demand remains low; this causes a deep dip in the curve that reflects oversupply for the correlating demand. The effect on the energy spot market is a low energy price, which can even become negative if generation grows and demand declines toward the extremes.
Australian energy demand typically peaks when people arrive home from work in the afternoon or evening and switch on their lights, cooking appliances and heaters or air-conditioners, depending on the season. The sun is no longer shining and the energy market pushes wholesale spot prices up in response to the increase in demand.
With COVID lockdowns and the subsequent phased return to work, Australians are spending more time at home during the day, causing a shift in demand patterns. Many are questioning whether these changes to ‘normal life’, will have a significant impact on the solar curve, and whether the system will need to adjust.
Is the residential market replacing commercial energy use?
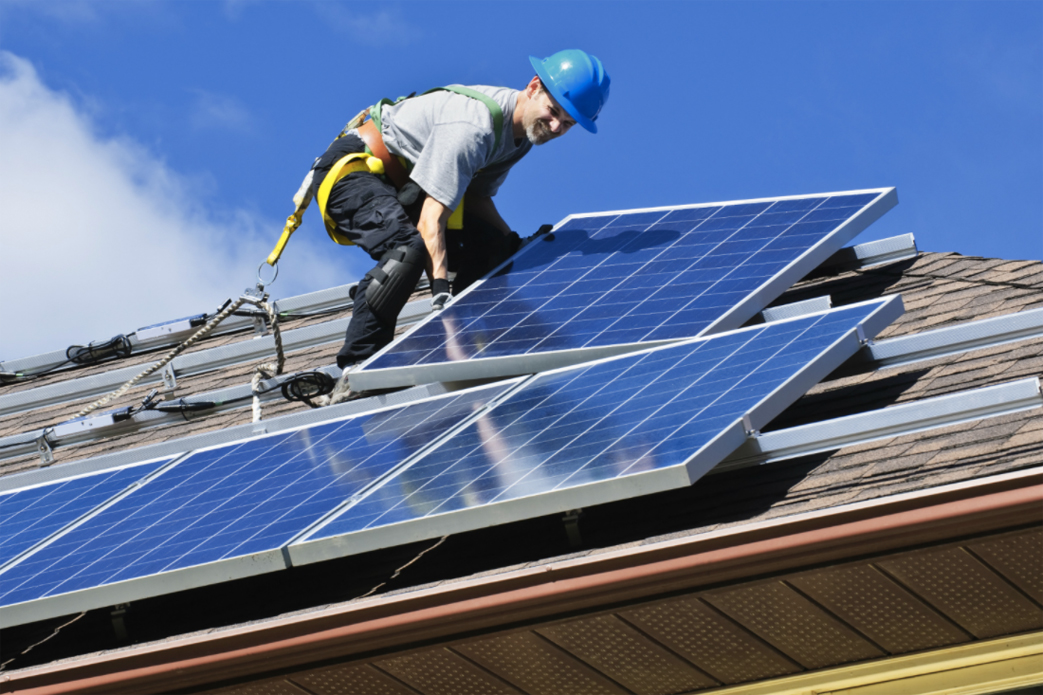
Between April 2019 and April 2020, average estimated rooftop PV production increased in all states, with the exception of Tasmania. This trend was the inevitable consequence of an ongoing uptick in the number of home solar installations across the country.
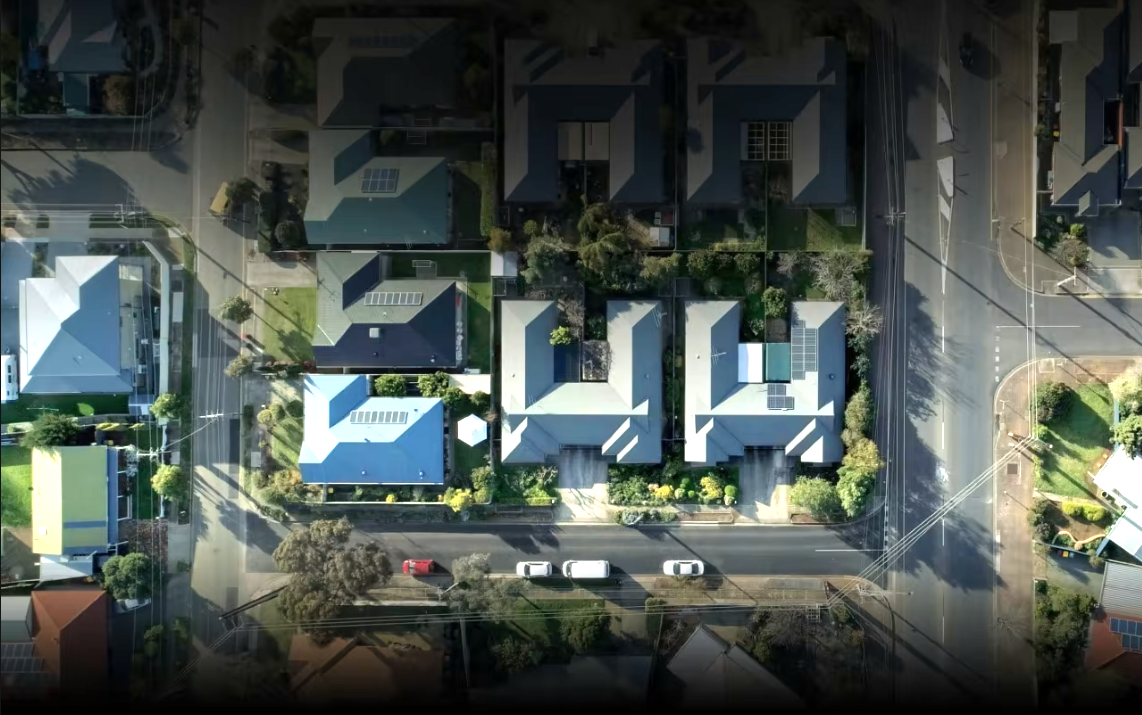
During lockdown, large-scale commercial enterprises powered down, and Aussie homes powered up.
Year-on-year we’ve seen a general downward trend in electricity demand in the middle of the day, and during lockdown midday demand remained low, in fact we saw the differential between supply and demand grow. For example, New South Wales saw a 500 MW reduction in midday demand, while solar output only increased by 250 MW.
This data suggests that the reduced energy consumption caused by severely limited activity of commercial enterprises, pubs, cafes, restaurants and other venues has not impacted the solar curve, even with users staying at home and consuming their rooftop solar output. This is surprising because self-consumption of solar should actually be increasing net demand on the system, yet demand remained low.
From what we’ve seen at peak lockdown, residential energy consumption is not great enough to make a significant impact on the solar price curve. Market mechanisms and tools are required that can automatically suppress solar generation when negative prices occur, ultimately protecting the user.
How lockdowns impact the road to net-zero
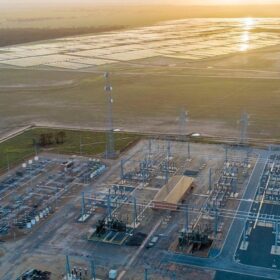
When there is less demand on the network, renewables can have a greater impact. For example, over the 2020 Easter weekend during lockdown, the share of renewables in the National Energy Market exceeded 50% for the first time.
COVID-19 has also triggered some delays in renewable projects. It’s likely we will see the amount of renewable energy contributing to the network remain at a steady level over the next two years, at least while we wait for new projects to enter the system.
Around two to four gigawatts of renewable generation had been expected to enter the market this year, instead, between 500 MW and and 1 GW have come to fruition. This decrease in electricity supply from renewable generation in the grid will likely lead to a smaller solar curve this year.
However, it’s difficult to foresee how significant the impact of this will be, due to the continued uptake of rooftop solar by homes. More and more Australians are investing in rooftop solar — perhaps especially as they spend more time at home — with an increase of over 500 MW of residential solar generated in New South Wales and Queensland in the past year (April 2019 to April 2020).
Matching solar ahead to recovery
Matching solar generation with energy users is the most viable way for commercial energy consumers to take advantage of the low prices renewable energy offers, while at the same time supporting the transition to a low-carbon future and promoting renewable projects in Australia. We all know that renewables are now the lowest cost source of energy.
Grid emissions levels are also the lowest we’ve seen since the NEM began in 1998, showing an overall decrease of 20% in the past three years, which demonstrates that the transition to a net-zero carbon future is within reach.
As the traditional behaviour of the workforce changes in response to the pandemic, it’s likely we’ll see a major shift in demand patterns across the energy network and potentially a flattening of the much debated ‘duck curve’.
The views and opinions expressed in this article are the author’s own, and do not necessarily reflect those held by pv magazine.
This content is protected by copyright and may not be reused. If you want to cooperate with us and would like to reuse some of our content, please contact: editors@pv-magazine.com.


2 comments
By submitting this form you agree to pv magazine using your data for the purposes of publishing your comment.
Your personal data will only be disclosed or otherwise transmitted to third parties for the purposes of spam filtering or if this is necessary for technical maintenance of the website. Any other transfer to third parties will not take place unless this is justified on the basis of applicable data protection regulations or if pv magazine is legally obliged to do so.
You may revoke this consent at any time with effect for the future, in which case your personal data will be deleted immediately. Otherwise, your data will be deleted if pv magazine has processed your request or the purpose of data storage is fulfilled.
Further information on data privacy can be found in our Data Protection Policy.