The total utility-scale PV generation in the National Electricity Market (NEM) for March 2021 is in! And up 36% on the same month last year, according to Rystad Energy’s latest bi-monthly Watts Generating report which covers the renewable energy output of 72 PV assets across the nation, and identifies trends in the NEM and Western Australia’s Wholesale Electricity Market (WEM).
In 2020, large-scale PV generated 550 GWh of power during March, and this year solar farms cranked out 746 GWh of electricity.
Plus there’s much more sun in the pipeline, with New South Wales and Queensland socking it out for supremacy in the solar generating stakes.
In March, Queensland beat NSW by a whisker, putting out 280 GWh of power from utility PV, compared with the NSW tally of 279 GWh.
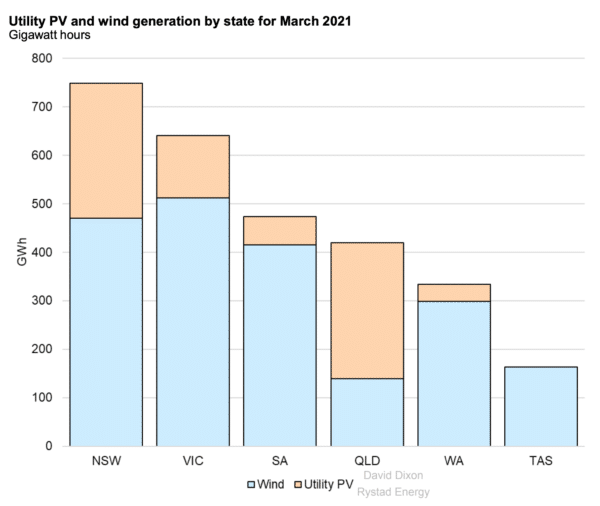
Image: Rystad Energy
“But NSW is currently the regional hotspot for commissioning activity,” writes David Dixon, Senior Analyst in the research company’s Australian renewable energy division.
Of the 18 renewable energy assets currently undergoing commissioning around the country, 11 are located in NSW, with PV concentrated in the West Murray and Central West regions. Of 1276 MW due to be commissioned in the NEM in coming months, NSW can lay claim to 946 MW.
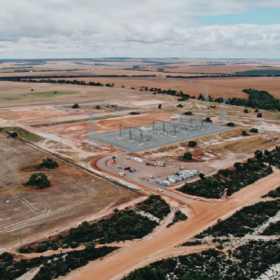
Among the NSW solar farms about to complete commissioning are Edify Energy’s 275 MW Darlington Point Solar Farm, RWE’s 220 MW Limondale 1 Solar Farm; John Laing/Maoneng’s 200 MW Sunraysia Solar Farm; and Lightsource BP’s 174 MW Wellington Solar Farm.
The majority of these projects have come out of a morass of challenging network conditions that resulted in long delays to grid connection, costly add-ons such as Darlington’s two synchronous condensers, and a retreat from further renewable investment by developers such as John Laing.
March itself saw commissioning of Total Eren’s 200 MW Kiamal Solar Farm in Victoria, which is the biggest large-scale solar farm to be fully operational in the NEM, overtaking Neoen’s 150 MW Coleambally Solar Farm and Blackrock and Edify’s 150 MW Daydream Solar Farm.
Kiamal has also had its share of challenges, which Dixon notes included “the exit of its EPC Biosar half way through the project, the requirement to install a synchronous condenser and marginal loss factors in the region being downgraded in recent years”.
Rystad found that the highest-performing PV assets in Australia by AC capacity factor were in Western Australia: with Synergy’s 40 MW Greenough River 1 Solar Farm generating at a capacity factor of 32.5% and Risen Energy’s 100 MW Merredin Solar Farm coming in at 32.4%; and Queensland dropping a percentage point or so with the still high-performing Kidston Solar Farm at 30.8% capacity factor.
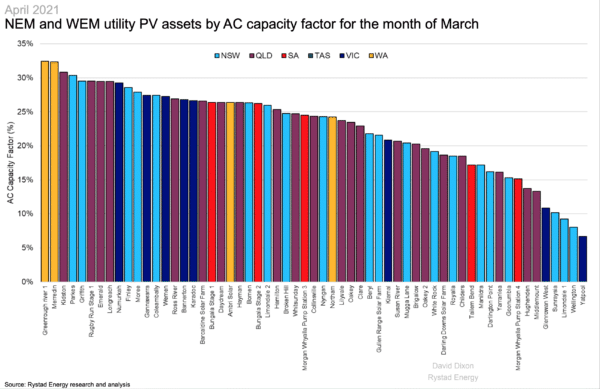
Image: Rystad Energy
Capacity factor relates to the amount of energy actually produced relative to the hypothetical maximum production that the asset is capable of when running 100% of the time. PV generation is of course limited to certain hours of the day, impacted by cloud cover, and may be curtailed at times and for various reasons by energy market operators.
Overall Queensland had the highest capacity factor ratings for March, according to Rystad Watts Generating report, with the largest number — nine of 26 — solar farms generating at 25% AC CF or more during the month.
And Neoen retains its position as the top generator of utility-scale solar in the country.
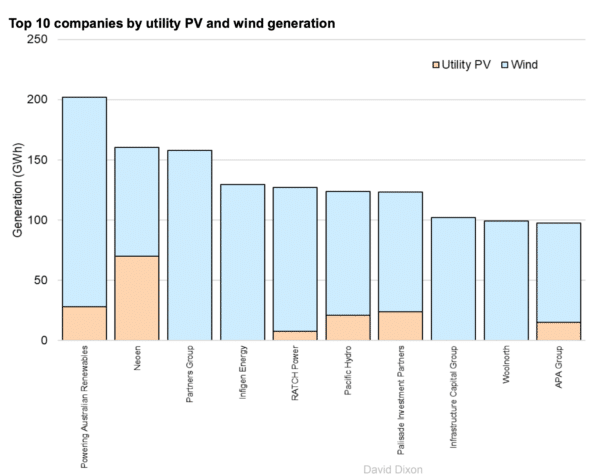
Image: Rystad Energy
This content is protected by copyright and may not be reused. If you want to cooperate with us and would like to reuse some of our content, please contact: editors@pv-magazine.com.


By submitting this form you agree to pv magazine using your data for the purposes of publishing your comment.
Your personal data will only be disclosed or otherwise transmitted to third parties for the purposes of spam filtering or if this is necessary for technical maintenance of the website. Any other transfer to third parties will not take place unless this is justified on the basis of applicable data protection regulations or if pv magazine is legally obliged to do so.
You may revoke this consent at any time with effect for the future, in which case your personal data will be deleted immediately. Otherwise, your data will be deleted if pv magazine has processed your request or the purpose of data storage is fulfilled.
Further information on data privacy can be found in our Data Protection Policy.