As panel prices rose and feed-in tariffs fell in Australia during the pandemic years, solar payback periods as much as doubled between 2020 and 2022. “So we went from the typical payback period of four years to six years within one year, and it still went out further,” Warwick Johnston, managing director of solar and storage analyst Sunwiz, tells pv magazine Australia.
“With prices panel prices falling again, we’re now back under the average,” he adds. “Still pretty high but it’s turned the corner.”
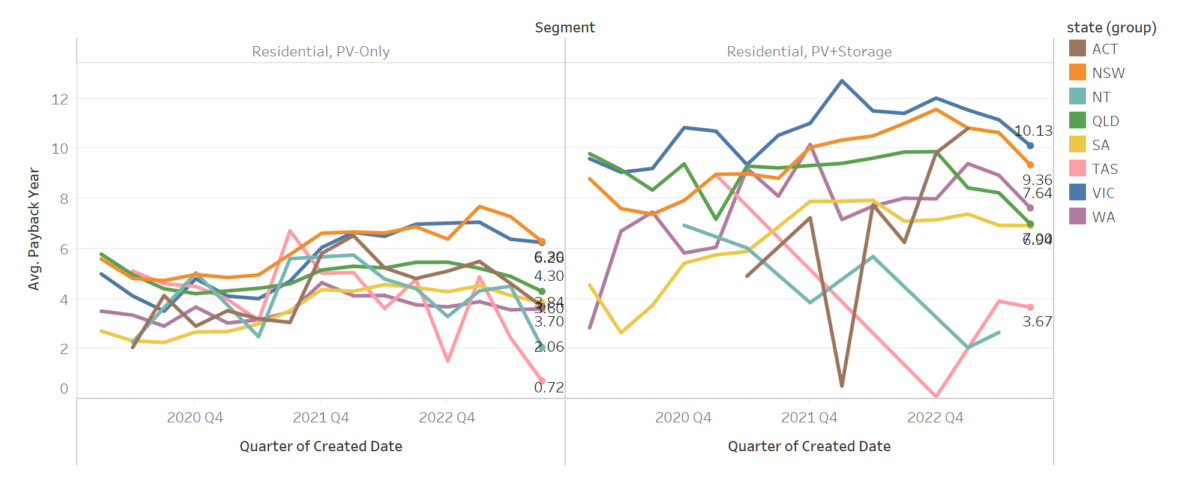
The variation between states has become particularly marked in the last year though, with Queensland departing from its New South Wales and Victorian peers – especially when it comes to battery storage. “We’re starting to see Queensland having a significant shortening in battery paybacks. To go from 10 years to 6.6 years in the space of six months is pretty crazy.”
Looking at residential solar + battery storage, payback periods have dropped across the board since Q4, 2022, with declines in all states bar South Australia. While paybacks have improved, including in New South Wales and Victoria, the timelines in both states remain considerable at 9.36 and 10.13 year respectively – well above Queensland. “Victoria and NSW still at their highest level, but Queensland is really driving low,” Johnston says.
While not as stark as Queensland, Western Australia has seen a noteworthy drop in battery paybacks at 7.64 years today, down from just below 10 years in Q4, 2022.
In terms of residential PV only, the state variation is again stark – but mostly in the least populace regions. Shifts in Tasmania appear to be particularly violent, moving from five years in early 2023 to just 0.72 years, according to the data. Payback periods in the Northern Territory have similarly plunged this year.
The declines in all other states pertaining to solar only have been more reserved. “I suspect it will go further, driven by panel prices,” Johnston says.
This content is protected by copyright and may not be reused. If you want to cooperate with us and would like to reuse some of our content, please contact: editors@pv-magazine.com.



Could you add detail to your article, like what size solar and battery they are referring to and what is causing the difference between states?
Hi Daniel, the sizing is averaged out but for more granular data, Sunwiz are the people to go to. As for what is causing the difference between the states, it is difficult to pin down and likely a confluence of things. For instance, systems in Victoria get less STCs than those in Victoria, but I couldn’t tell you the exact drivers.