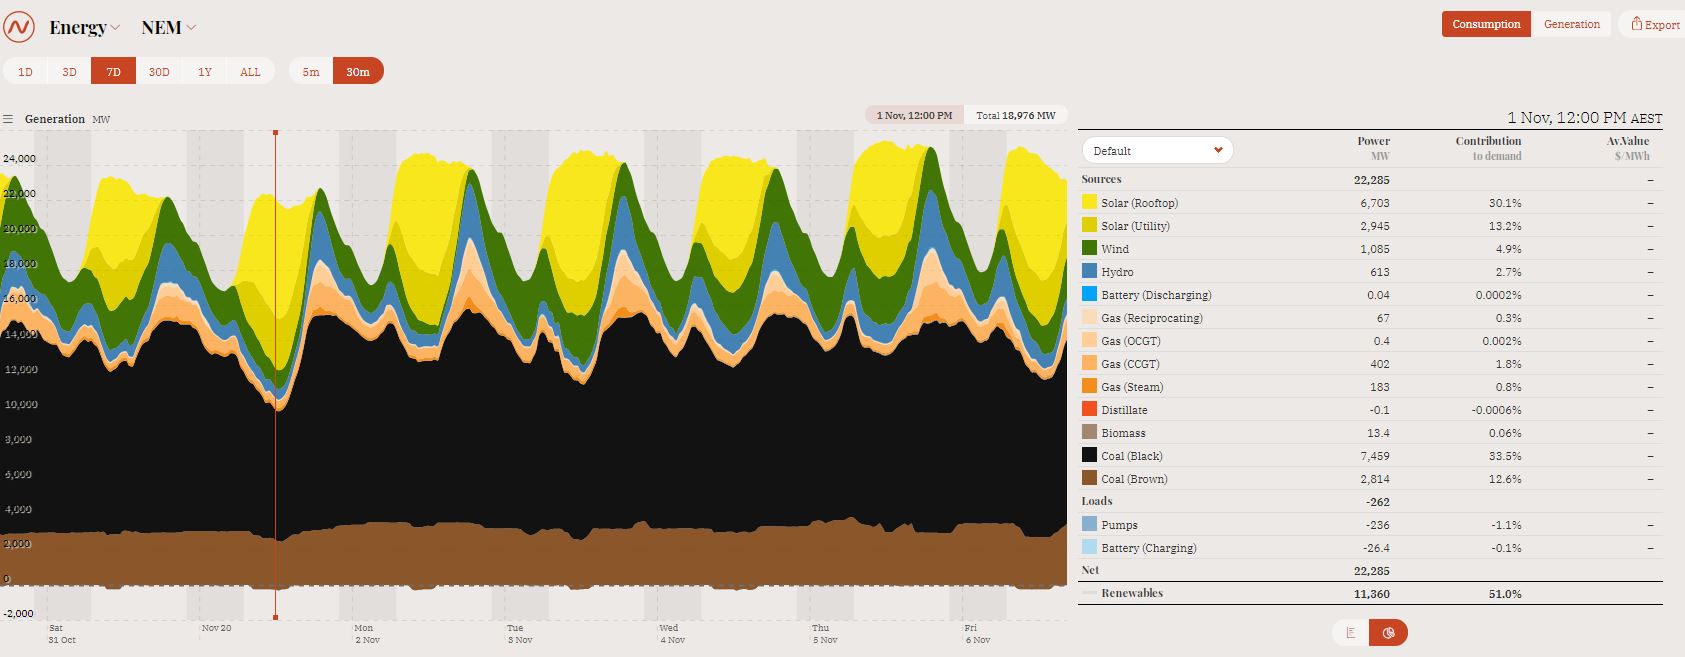
Data provided by OpenNem.org.au shows that in the first few days of November, renewables have delivered record shares of electricity in the NEM, including a high of 51% on the first day of the month. Solar PV dominated the renewables, delivering a 43.3% share at midday on November 1 with rooftop modules responsible for a staggering 30.1% or 6,703 MW.
Simon Holmes a Court, a senior advisor to the University of Melbourne-based Energy Transition Hub, labelled the mark a new record for solar power in Australia.
“This was thought impossible just a few years ago,” he tweeted.
“We really need to start documenting naysayers’ claims … they’re going to be regularly humiliated by reality over coming years.”
The 50% milestone was surpassed again just two days later with a 50.3% or 12,635 MW share of electricity in the NEM coming from renewables. Rooftop solar again dominated with 29.6% or 7,427 MW while utility PV delivered 7.8% or 1,960 MW. Wind delivered 11.2% or 2,822%.
The new daily highs come with Australia having achieved record levels of renewable generation in the past two months. September 2020 was the first month the NEM has recorded more than 30% share of electricity coming from renewables. That feat was repeated in October and if current figures continue the 30% mark will again be surpassed for the month of November.
Dave Dixon, senior analyst with Rystad Energy Australia, said on Friday the capacity is there for the renewables share to continue climbing with the latest figures showing there is 78 GW of utility solar PV in the pipeline at all stages of development. At or beyond financial close, already operating under construction or about to start construction, the pipeline stands at 6.85 GW.
“This is only utility scale, it doesn’t include any rooftop numbers,” he said. “It’s pretty mind blowing how much there is in the proposed pipeline in Australia.”
Dixon said the growth in solar in Australia had been exceptional with rooftop PV the biggest generator in the country.
“It’s important to note just how much has come online in such a short space of time,” he said. “In three years since 2017 we’ve gone from, if you combine utility PV and rooftop, 5 GW to 14 GW.
“That’s a 200% increase in just three years and there’s still quite a bit to come online. Our latest numbers show there’s still about 4 GW of wind in construction and commissioning phases and 2.4 GWac of utility PV, plus anything that goes on top of the rooftop so it’s an incredible amount of capacity that is to come online.”
Dixon did however caution that the rise in the renewables share could present challenges for the NEM, pointing to grid congestion, particularly in north Queensland and on the NSW and Victorian border. He also identified power system services such as system strength, inertia and voltage control, traditionally provided by conventional thermal generation.
“It really will depend on the level of flexibility you have in the system,” Dixon said.
The Australian Energy Market Operator (AEMO) earlier this year declared the technical capacity is already there for the NEM to reach 75% renewable penetration but clarified that by saying market and regulatory reforms will be needed going forward.
AEMO data shows the NEM currently has 17 GW of solar and solar generation capacity but predicted that could rise to 27 GW by 2025.
AEMO CEO Audrey Zibelman said the Renewable Integration Study had made it clear that current operating approaches and market frameworks are becoming less effective and unless changes are made, they will be forced to cap renewables.
“Given the pace and complexity of change in the NEM, the study highlights the need for flexible market and regulatory frameworks that can adapt swiftly and effectively as our understanding of the changing power system evolves,” she said.
“Australia already has the technical capability to safely operate a power system where three-quarters of our energy at times comes from wind and solar energy generation.
“However, to do so requires changes in our markets and regulatory requirements, otherwise, AEMO will be required to limit the contribution of these wind and solar resources to 50 or 60% of electricity supply at any point in time, even though they are the lowest cost way of providing electricity.”
This article was amended on 6/11/2020 to correct the utility scale PV pipeline numbers from Rystad.
This content is protected by copyright and may not be reused. If you want to cooperate with us and would like to reuse some of our content, please contact: editors@pv-magazine.com.


By submitting this form you agree to pv magazine using your data for the purposes of publishing your comment.
Your personal data will only be disclosed or otherwise transmitted to third parties for the purposes of spam filtering or if this is necessary for technical maintenance of the website. Any other transfer to third parties will not take place unless this is justified on the basis of applicable data protection regulations or if pv magazine is legally obliged to do so.
You may revoke this consent at any time with effect for the future, in which case your personal data will be deleted immediately. Otherwise, your data will be deleted if pv magazine has processed your request or the purpose of data storage is fulfilled.
Further information on data privacy can be found in our Data Protection Policy.